
Maybe you’ve got your site tip-top in terms of technical SEO or perhaps you’re just starting out. Either way, understanding where you sit - or could sit - within the plethora of sites out there is critical when it comes to developing an effective digital marketing strategy.
This post aims to provide you with a step-by-step guide on how to perform actionable competitor research without relying on expensive purpose-built tools (wherever possible).
By following the steps in this guide you will gain a better understanding of your competition and a clearer idea of the marketplace you’re trying to target.
Free competitor dashboard template
Make life easy for yourself and download our free demo template as it will be referenced throughout the article and does a great deal of the leg work for you!

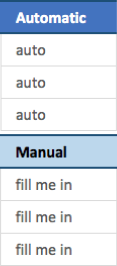
You will need a basic understanding of Excel to complete your analysis (copying down formulas, find and replace, remove duplicates, paste as values etc). The sheet is colour coded as shown below:
Automatic
Content in these columns will fill out automatically when all the data has been entered into the document.
Manual
You need to enter data or copy & paste information into these cells. They often feed graphs or the automatic calculations previously mentioned.
Company and sector
The process detailed in this guide can apply to any sector but, to avoid being too broad, we’ll use a business with the following outlook:
“We’re a women’s fashion brand, we sell in shops and concessions but need to press into the online marketplace. This is because data shows our target market - women aged 30-50 years old - are completing an increasing number of purchases online.”
There are very few businesses that don’t need an online presence nowadays and browsing continues to become more and more accessible. Whether your audience is comparing energy prices, researching hatchbacks or simply looking for a new outfit – chances are their journey will either start or finish online.
As such, even if you don’t have a digital presence, you can still have digital competitors and it’s important to find out who they are.
Types of competitor
It’s rare to work at a company where everyone agrees on who its top competitors are, and in an industry as saturated as fashion it often comes down to the personal taste of whoever you’re asking, with factors such as recent exposure to brands via social, remarketing, new purchases, lunch-time browsing, TV and YouTube adverts swaying opinions.
To help, we thought it would be handy to consider competitors in the following way. Please note that these categories are not mutually exclusive and competitors can belong to one or all of them:
- Style Competitors: The products you both create are similar in their appearance and/or operation. Trends and ‘inspired’ pieces can create a serious sense of design déjà vu. Style competitors naturally occupy the same space as you
- Income Competitors: Just because a company creates a totally separate product, it doesn’t mean you aren’t competing - expendable income is not an endless pot and considered purchases are often weighted on impact (new kitchen vs new car).
These competitors are difficult to identify and often require detailed personas to understand the needs of your target market. This is something we are going to look at in more detail in another post coming soon!
- Digital Competitors: The focus of this guide. A search engine user/customer signals their intent based on their keywords and search terms. The natural results found in a search on Google (or Bing/Yahoo) for keywords you’d like to rank for are your digital competitors.
We’ll be focusing purely on digital competitors for the purpose of this guide, and to make a start we’re going to need a keyword set…
Performing basic keyword research
The importance of getting a keyword set cannot be understated. The work you do here can be used for so much more on your site - it’s worth either committing time and resources to doing this properly or (better yet) asking us to do it for you.
We’re producing a guide specifically on this topic in the coming weeks so make sure you’ve signed up to receive it.
Below are some of our favourite paid tools to perform this work. It’s important to note that paid tools often have trial periods and restricted accounts that could help with research.
- Ahrefs Keyword Research Tool
- Sistrix
- SEMRush
- Moz
We’ll provide six basic steps that will allow you to perform keyword research around the more popular search terms using the free tools listed below.
- AdWords Keyword Planner
- Google Search Console
- Your colleagues
You will need a Gmail account to sign up for AdWords (just skip any campaign setup at this point - you just want access to the keyword planner)
If you’re super organised, you may already have a keyword list from PPC or you might already be working with an agency who should be sharing this information with you. If that’s the case, we advise checking that list against the below recommendations.
Step 1 - Categorise, categorise, categorise
One of the steps often left until the end of keyword research is the categorisation – sometimes it’s just skipped entirely. Categories are critical to helping you understand different product types, hence why it’s the first point on our list.
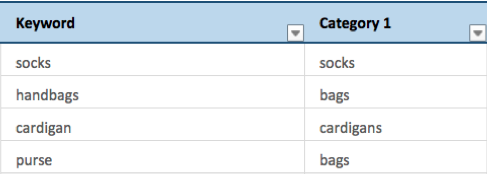
Below is an example of how we’ll be laying it out in the sheet. It’s important for you to establish your core categories early on as there is a fine line between being too broad (for example: footwear) and being overly specific (example: printed red cotton shirts). The balance will depend heavily on your product range and the keywords you identify.
Ensure that if you’re targeting more than just one gender you categorise your terms appropriately, taking into account Male, Female and (importantly) Generic/Neutral terms.
Note: Remember you can always go back and make the categories more specific, or even add in additional columns, rejig pivot tables and drill down into the finer detail.
Step 2 - Manual list
Start off the keyword process by listing your products and your product categories. We recommend setting these up in a separate Excel document - ensure you back it up and save regularly.
- Avoid using symbols such as ‘&’
- Skip punctuation such as apostrophes, commas, question and exclamation marks. We want to avoid duplicating keywords when these characters get removed later on.
Don’t spend too long on your manual list, just make sure it’s broad enough to cover your product range so that other tools can generate suggestions based on the data you provide.
Step 3 - GSC console
If you have Google Search Console, log in and navigate to Search Traffic > Search Analytics

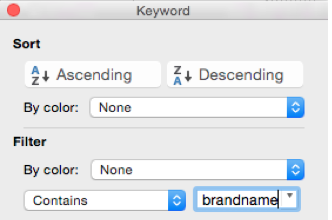
Scroll down and you’ll see a list of words that users search to find your website. For now, we just want keywords that don’t include your brand name. Export them all, and use Excel to filter for the brand name. Either delete these keywords or remove the mention of your brand.
Exception: If other retailers sell your product in addition to you selling it directly, you may wish to leave your branded terms in.
Add these to the column with your manual keywords and remove any duplicates by selecting the keyword cells and clicking on Data > Remove Duplicates.
Note: If you don’t have Google Search Console, we strongly recommend it for anyone interested in the status of their website. There are lots of implementation methods but, if you have Google Analytics, that’s often the easiest way.
Step 4 - Keyword tools
Log in to or create an AdWords account, click on Keyword Planner https://adwords.google.com/KeywordPlanner and enter the keywords you’ve found so far. This tool acts like a thesaurus based on similar search terms. You can either extract them all and sort them in Excel or pick the ones you feel are the most appropriate to your products and services.
To assist with categorisation, we recommend performing this exercise multiple times using different ad groups to set up your primary categories, as shown below:
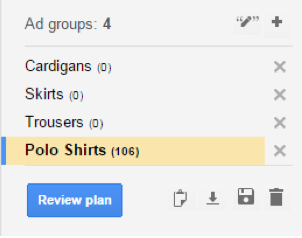
Save often, and don’t be fooled by what appears to be a biscuit tin icon. It will delete your work (on prompt), only providing you with cookies of sadness and repetition.
Top Tip: Don’t get hung up on volume at this point, we’re looking to compile a comprehensive list. It is important that you use keywords relevant to the products you sell; intent and CTR tend to rise with relevance and specificity. For example, the below are all valid keywords, with the longer tail keywords likely to have less competition (and volume):
- Cardigan
- Knitted Cardigan
- Knitted Wool Cardigan
- Cream Knitted Wool Cardigan
- Cream Lattice Knitted Wool Cardigan
It can be better to rank 1st for a keyword with just 50 searches a month if your product exactly matches what the user is searching for.
Step 5 - Don’t forget queries/guides
“Washing wool jumpers” may not seem like an important transactional term but, if people search for it, you can gain authority by building content around such terms. More importantly, a visit to your site is another potential revisit/purchase via Facebook advertising and Remarketing campaigns. You’ll also find that, if your content is awesome, people may link to it.
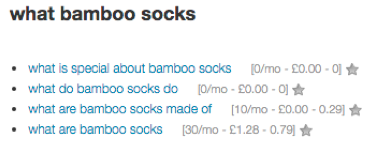
We often find that Answer The Public and Storybase offer an interesting selection of popular queries around the larger/broader keywords.
Storybase
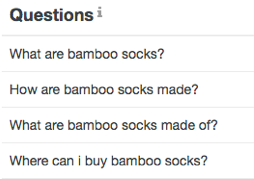
Answer the Public
Step 7 - Categorise
This is so important that it deserves its own reminder, ensure your keywords have a category.
Step 8 - Remove punctuation and duplicates
By now you’re likely to have a good keyword set. Make sure you remove the punctuation previously mentioned, or any accidental double spaces with ‘find and replace’. Also double check there are no own-brand mentions (if needed). After this, select your data and remove any duplicates.
Ensure the “Keywords” tab of the spreadsheet contains each keyword and its category.
Step 9 - Pump up the volume
We use an in-house tool to provide accurate volume predictions against keywords. However, you can use ‘Keywords Everywhere’ - a really useful Google Chrome extension that allows for the bulk upload of your keywords to receive approximate volumes. If you have an ongoing AdWords campaign you can also use Google’s AdWords planner to obtain keyword volume too.
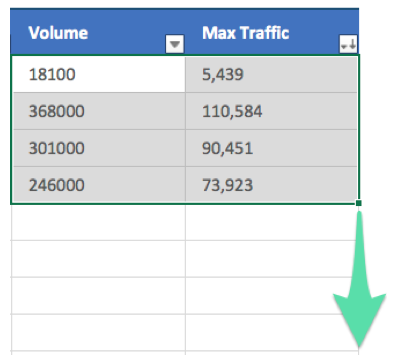
Simply copy the keywords you have and pop them into the bulk upload area (shown below), then export and right click > paste special (as values) into the ‘Volume’ tab in the spreadsheet. If you have followed the process correctly and removed punctuation the keywords should all provide a volume.
Please note: If you find the Keywords Everywhere tool useful, make sure you share it to ensure its kept free.

Important: Change any zero values to 5 or 10 to prevent errors in the sheet. This is often needed when looking at niche terms and without the more accurate results provided by paid tools. If any of your keywords aren’t returning a value, you can see this in the error reporting just above the ‘Max traffic’ column.
If you’re still having problems, remember the values are returned using a lookup formula so it’s likely that the keywords are missing or misspelled in the ‘Volume’ tab. If you can’t get it to function you can simply overwrite the formula in the ‘Keywords’ sheet.
Keywords=Done! Naturally when using paid tools this can be a much longer, accurate and more in-depth process, often generating more keywords and giving a much clearer impression of the market.
If you haven't already, now would be a good time to download our free tool, click the button below to get started.
Obtaining rankings
Once more, we turn to an in-house tool to perform this laborious task. For an alternative solution, we recommend heading over to the fine folks at URL Profiler to make use of the SERP Scraper (http://urlprofiler.com/free-tools/) tool. Unless you’re using anonymous private proxies you may need to stagger your queries in batches of ~100.
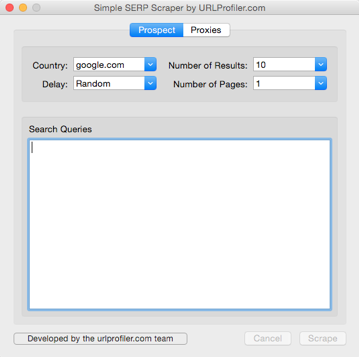
- Set your country appropriately.
- Keep the delay on Random.
- Select the No. of results (up to 100). We recommend 50, without the use of proxies.
- Calculate the pages to set based on the no. of results (10 per page).
- Paste up to 100 keywords into to search queries box and hit ‘Scrape’.
Please note: It’s important to understand that if you’re only looking at rankings between 1 and 50, any sites (including yours) that rank 51+ will not show up and this can make it difficult to understand where your opportunities are in terms of improvement.
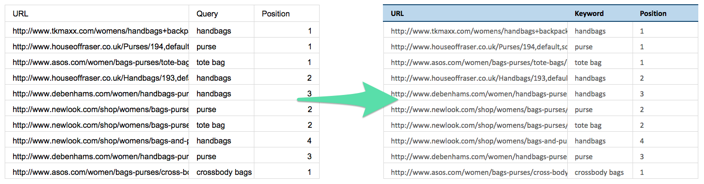
Once completed you’ll have a simple document with 3 columns:
URL: The ranking page address.
Query: The keyword.
Position: The ‘rank’ or SERP position.
Copy this data and right click > paste special (as values) into the ‘Rankings’ tab of our spreadsheet, ignoring the headers as shown below:
Combining CTR and volume
Just because a site ranks first for a term that has 1000 searches a month, it doesn’t mean they receive all that traffic. The percentage of traffic received from these searches is referred to as the click through rate (CTR).
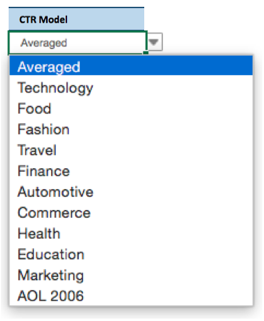
In the “Config” tab we have used an average of various click through rate studies to suggest the percentage of clicks received, position by position. However, you can also select the drop down box to select a more appropriate industry or CTR study (if you’re unsure, stick to ‘averaged’).
Once you have pasted in all your volumes and SERP rankings, ensure you drag down the formulas of the data found underneath the darker headers in the ‘Keywords’ and ‘Rankings’ tabs. Either double click the small green square to copy down the formula or drag this square down manually.
Marketplace analysis and graphs
Let’s quickly check you’ve got all your data:
- A list of keywords?
- With categories?
- ...and volume?
- The top 50+ ranking pages for these keywords.
Now let’s check it’s in the right place:
- The ‘Rankings’ tab is filled with the SERP scrapes.
- The ‘Keywords’ tab is filled with keywords and categories.
- The ‘Volume’ tab is filled with keywords and their respective volumes.
- All formulas have been pulled down to perform any automatic calculations.
Great – now let’s get cracking.
Your digital competition
Pivot - domains
To quickly understand who your competitors are, we’ll be using pivot tables. To ensure we’re looking at your latest data we need to refresh the Pivot Table:
- Click on the “Pivot - Domains” tab.
- Select any cell within the pivot table.
- Select the PivotTable Analyze ribbon.
- Click Refresh.
By default the table is setup to arrange by visibility. This can be confirmed by selecting the below settings:
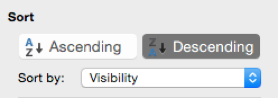
This table is now showing you the top performing domains based on predicted traffic against rankings for your supplied keyword set.
You have a couple of options of where to go next:
Aiming High!
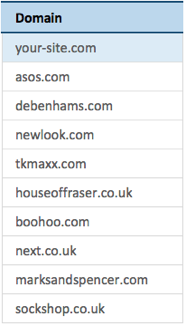
Select the top 9 domains with the highest visibility to understand the market leaders.
Focused Fire
Pick the 9 competitors above you to analyse the nearby competition.
Spot & Snipe
Pick and choose the competitors that you feel are more appropriate to your business, perhaps based on product offering or target market.
Once you have selected the competitors, copy and paste the domains (as values) into the ‘Config’ tab – don’t forget that your site should always be first in the list.
Want to change the competitors you’re looking at? Just change the competitor domains in this list, it’s that simple.
Pivot - categories
If you’d rather look at visibility within a specific category, you can use the “Pivot – Categories” tab to expand the appropriate category and use that domain list to set your competitors instead. Again you’ll need to refresh this data first.
Overview dashboard
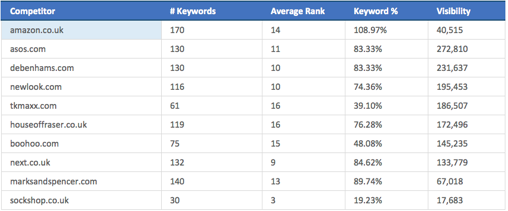
After you’ve placed the competitors in the ‘Config’ tab, the Overview Dashboard will automatically fill out the main visibility graphs and other tables. The main table is explained below and shouldn’t need to be amended.
Competitor: Automatically filled fields based on the competitors in the ‘Config’ tab.
# Keywords: The number of keywords the competitor ranks for.
Average Rank: The average rank across all keywords for which a competitor ranks.
Keyword %: The percentage of total keywords a competitor ranks for (this can deliberately exceed 100% if the competitor has multiple pages ranking for a single keyword).
Visibility: Estimated traffic based on both keyword volume and the CTR study specified.
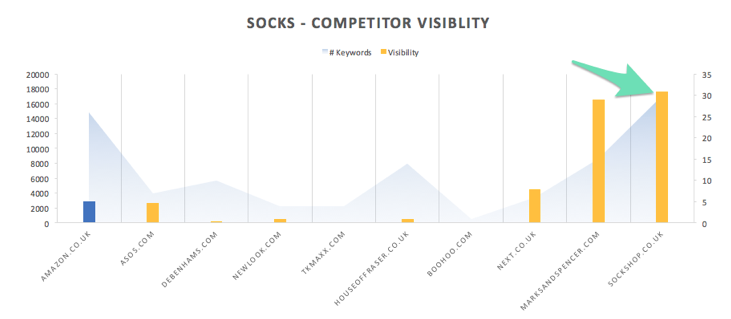
Competitor visibility graph
Columns on this graph indicate the visibility of the competing domains (your site is in blue). Area on this graph indicates the number of keywords the competing domains rank for
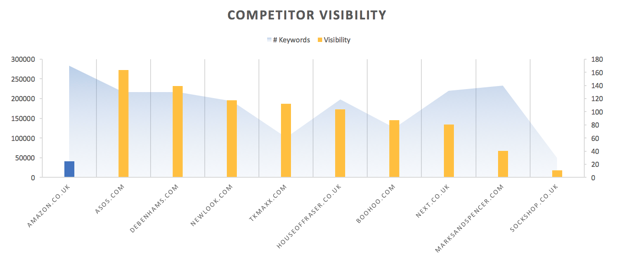
Q: "What if my column is a similar height to competitors but the area behind is low?"
A: You don’t rank for many keywords however those you do rank for are either high volume and/or your rank highly. You need to consider the similar terms you aren’t ranking for.
Q: "My column is the shortest, but the area behind is large – why is this?"
A: You rank for lots of keywords that aren’t driving traffic. Consider whether the keyword set is overly specific for any niche products you provide.
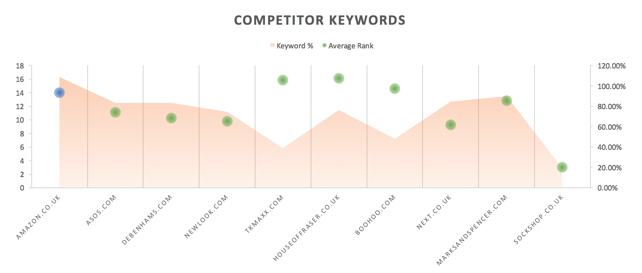
Competitor Keywords Graph
Dots on this graph indicate the average rank across the keyword set, the lower the better. Area on this graph indicates the percentage of keywords you rank for:
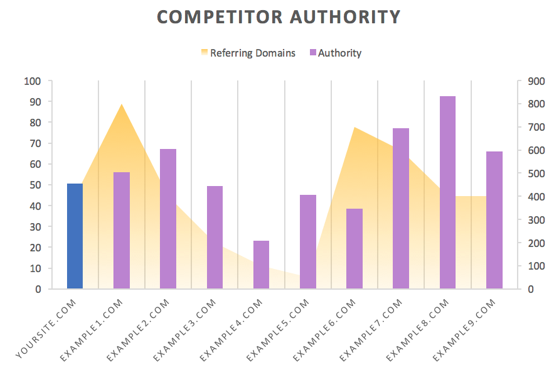
Domain authority table
Using a free account on https://majestic.com/ you can enter individual domains to acquire the information below:
- Referring Domains
- Trust Flow
- Citation Flow
- (Authority will calculate automatically)
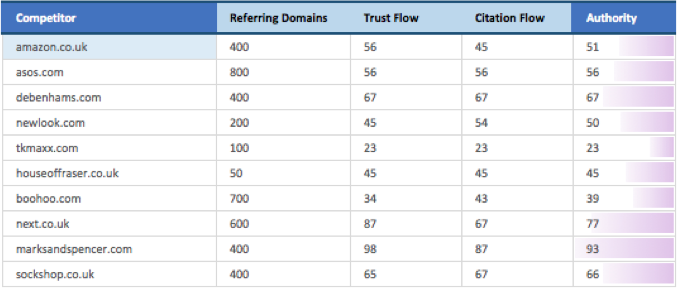
If you find that your authority is lagging behind your competitors, you’ll need to consider how to create quality content to gain you links. Critical to this is promoting your content to ensure you get it in front of people who will provide you with a citation. If you have a high number of referring domains but low TF/CF it suggests that those sites are of a low quality.
Competitor Authority Graph
Columns on this graph indicate the authority of competing domains (your site is in blue). Area on this graph indicates the number of referring domains the competitors rank for.
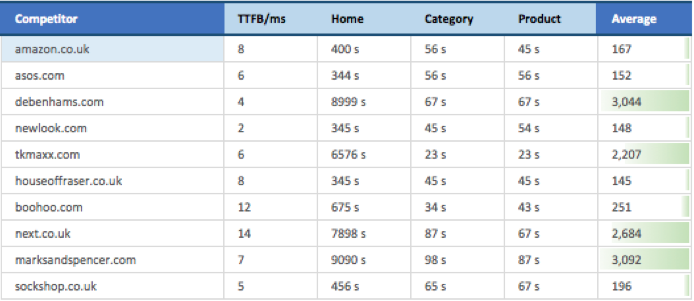
Site speed in seconds
Create a free account on https://gtmetrix.com and set your country. Then perform searches against each domain’s home, category and product/service pages.
TTFB (Time to First Byte) is the time taken from the http request to the first byte of the page being received by the client’s browser. You can find this in the timings tab within your Gmetrix report.
TTFB isn’t a critical metric, especially when factoring in how it can be treated by CDNs and NGINX compression, however it may highlight a potential pitfall with your web server.

Fill out the below fields for each competitor:
- TTFB/ms
- Home load time
- Category load time
- Product load time
- (Average will calculate automatically)
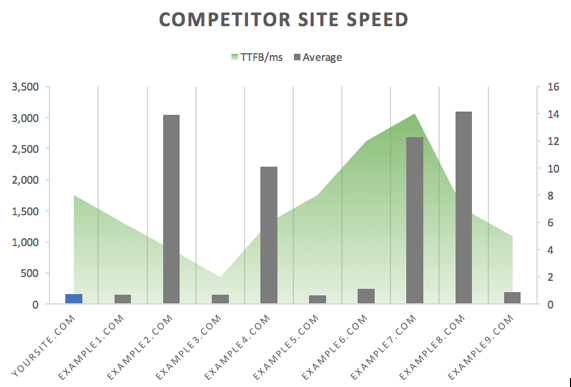
If you fall short in terms of site speed, GTmetrix will have provided you with a long list of issues on your site. You can resolve most of these with good site management and build. However, if you find anything ‘overly technical’ pass it over to your developers. You can run repeat tests to check if the changes are having an effect.

It’s now thought that site speed is even more important (as a ranking factor) with the mobile-first index. So we don’t recommend ignoring this or assuming it’s purely a UX issue.
Competitor Site Speed Graph
Columns on this show the average speed of competitor pages (again, your site is in blue). Area on this graph indicates the TTFB in ms.
Category dashboard
If you’re looking to analyse your chosen competitors against specific categories you can simply use the ‘Category Dashboard’ tab to enter a specific parent category (Cell C4) – allowing you to dig down further and find where a competitor is getting most of their visibility.

For example, the below overview screenshot suggests sockshop.co.uk is performing poorly against the entire keyword set.
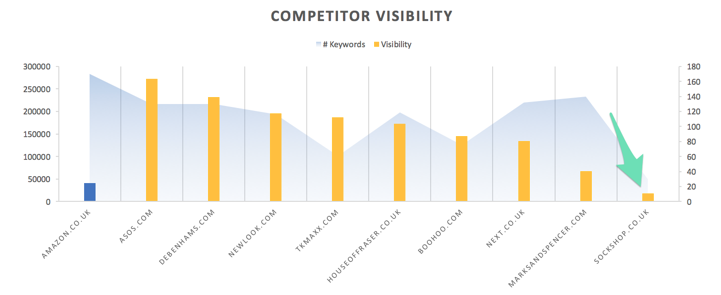
However, if we look specifically at the socks category the same domain now dominates both the number of ranking keywords and visibility.
You can duplicate this tab/sheet and repeat the process for multiple categories. We strongly advise renaming the sheet appropriately to keep the spreadsheet easy to navigate.
This data, and any screenshots you take, will help you to build a really strong, data-led presentation to the rest of your company or to help you understand changes in performance when the process is repeated.
Manual checks
Now that you have the top domains and pages for the categories/keyword groups you’re looking to target, you can start to assess exactly what is helping them to rank. Below is a checklist of on-page factors we recommend looking into.
- URL: Best practice is to keep this short and avoid special characters and capital letters. Don’t get hung up on anything after the ‘?’ at this point.
- Meta Title: Ensure it includes your primary keyword and ideally your brand too.
- strong>Meta Description: (not a ranking factor but can help CTR) Consider what the larger brands and competitors are doing to maximise CTR with their search results and any language used to encourage that crucial click.
- H1: Is it keyword rich and relative?
- strong>H2s: If needed, are sub headers such as H2s and H3s used to separate up content on the page?
- Hygiene Content: Do pages contain unique text of 50+ words relevant to the product, category etc?
- Number of Products: Very often you’ll find that a sparsely populated category page will provide a poor browsing experience. Check to ensure your pages aren’t too thin in terms of the number of products found on them.
- Social: Look at how these competitors position themselves on social media. What on site content do they post or is their content unique to social?
- Structure: Are you being too specific with your pages? Or, perhaps, not specific enough? Consider the purpose of the ranking page, is it likely to drive traffic, conversions or both?
- Content Type: Take note of the page being served to users. Is it a blog post, a product page, category page or just a static page?
Outcomes and summary
To help summarise the data you now have, we’ve made a quick summary:
- You know who your main digital competitors are.
- You have a list of performing URLs to analyse.
- You can rerun this to see how well your marketing strategy performs.
- You understand if your site needs links (vs competitors).
- You understand if your site has speed issues and how to fix them.
- You have a comprehensive & categorised keyword list that you can use help write on page content.
- You can also use the ranking competitor URLs to learn a bit more about the structure of these sites and the types of content that are ranking (blog posts, category pages and service pages).
All too much effort?
There is a lot of work in the process we’ve outlined. If it sounds like a lot of effort for very little reward – we’d love to prove you wrong.
Get in touch to find out how Zazzle Media can provide in depth competitor analysis and provide recommendations to improve your site’s visibility, rankings and most importantly – content.
We develop our tools 24/7 (sometimes we sleep…sometimes) and this tool is just part of a matrix that looks into:
- Keyword Research/Planning
- Head vs Body vs Longtail Performance and Opportunity
- Information and Transactional terms
- Difficulty and identification of quick wins
- Link assessment per URL
- Commercial intent
- Opportunity by position
We’d love to hear how you got on with the tool. Get in touch with any feedback or comments on other free tools you’d like to see from the team at Zazzle Media.
Stay in touch with the Zazzle Media family
Sign up for our monthly newsletter and follow us on social media for the latest news.