
Any website owner serious about improving the performance of their digital platform will understand the importance of gathering data and insight (from various tools) with the ultimate goal of improving overall performance. This said, many site owners still aren’t making use of free tools such as Google Search Console to measure performance effectively.
Google Search Console (or GSC – previously known as Webmaster Tools) is a free tool created by Google that covers a plethora of reports to improve your overall SEO. Any website can access GSC no matter the platform they are on, however it will need to be set up correctly to ensure you’re getting the most out of it.
In short, GSC is a reporting platform that allows you to keep on top of your site’s technical issues, overall site health and much more. Ultimately it allows you to understand just how ‘Google-friendly’ your site truly is – after all, the more aligned to Google’s guidelines you are the better your website is going to perform.
This guide will take a look at some of the key GSC reports and how you can get the most out of these tools to better your site performance.
Key reports for comprehensive measurement
Performance report
This report is probably the most used within GSC (it certainly is for me) to give a quick overview of how your site is performing within the Google Search results. The report quickly allows you to analyse the number of clicks and impressions as well as overall click-through rate (CTR) and average position of your ranking keywords, although to be able to get the most out of this data it’s essential you revisit often to be on top of any trends.
You also have the capability to set the date range for the data presented and can further scrutinise this by search type, specific queries (keywords), directories or individual pages across your site, country, device and the search appearance (filtering for AMP, rich results or web light results). The image below highlights a year-on-year comparison for total impressions (note: you can toggle through the various metrics which will compare on the same chart.)
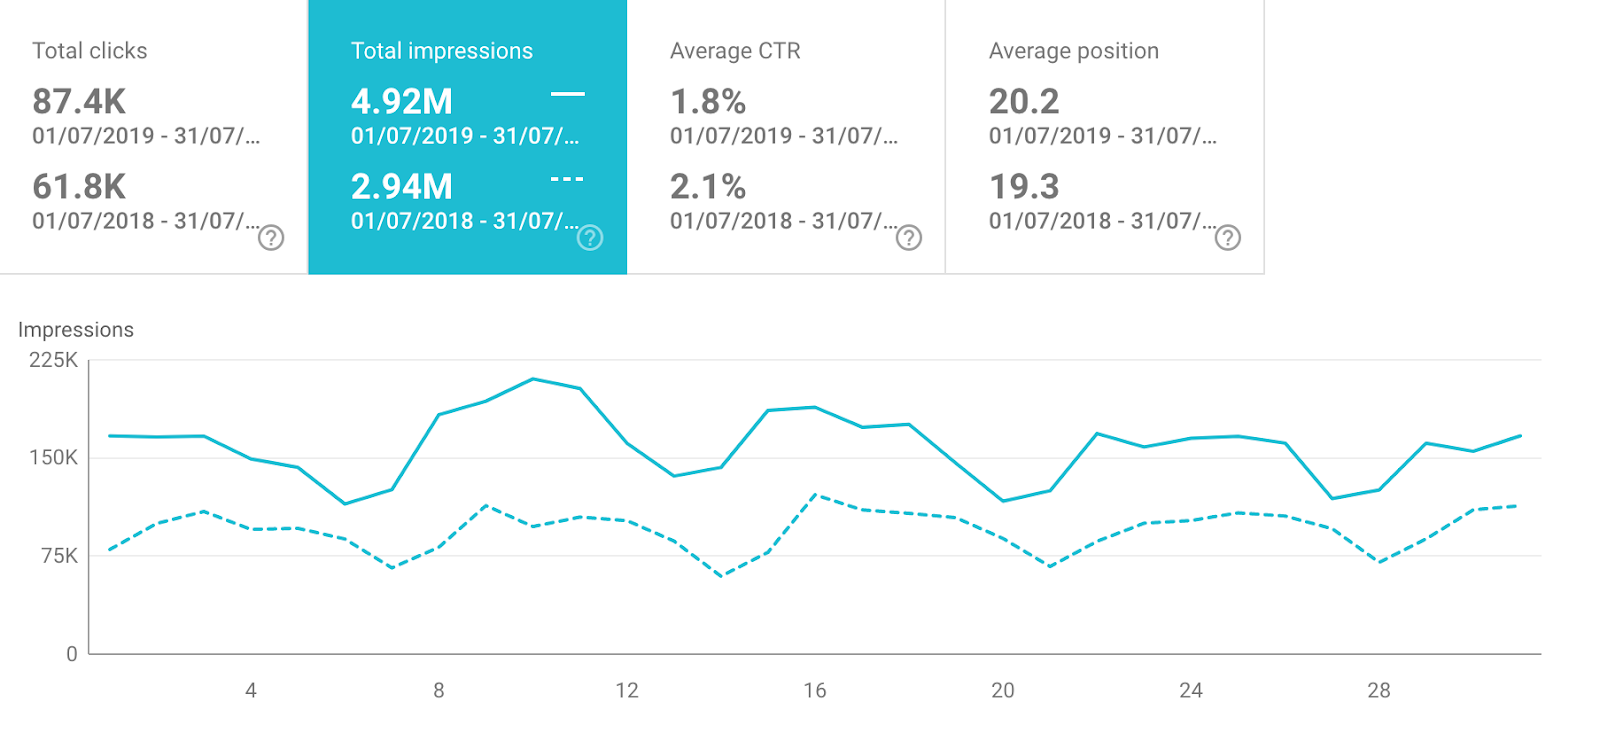
The great thing about the new Google Search Console is that you can now access data from the last 16 months, giving you plenty of insight to work with. I find this report really useful for a quick snapshot of performance and to highlight potential issues, providing good insight as to where to focus resources.
Under the performance chart you’ll find the ‘query’ table which is useful in identifying the search query (or keywords) that are gaining you impressions and clicks within Google Search results pages (SERPs). You can filter this view to see the highest/lowest performing keywords dependent upon your reporting needs (see below).
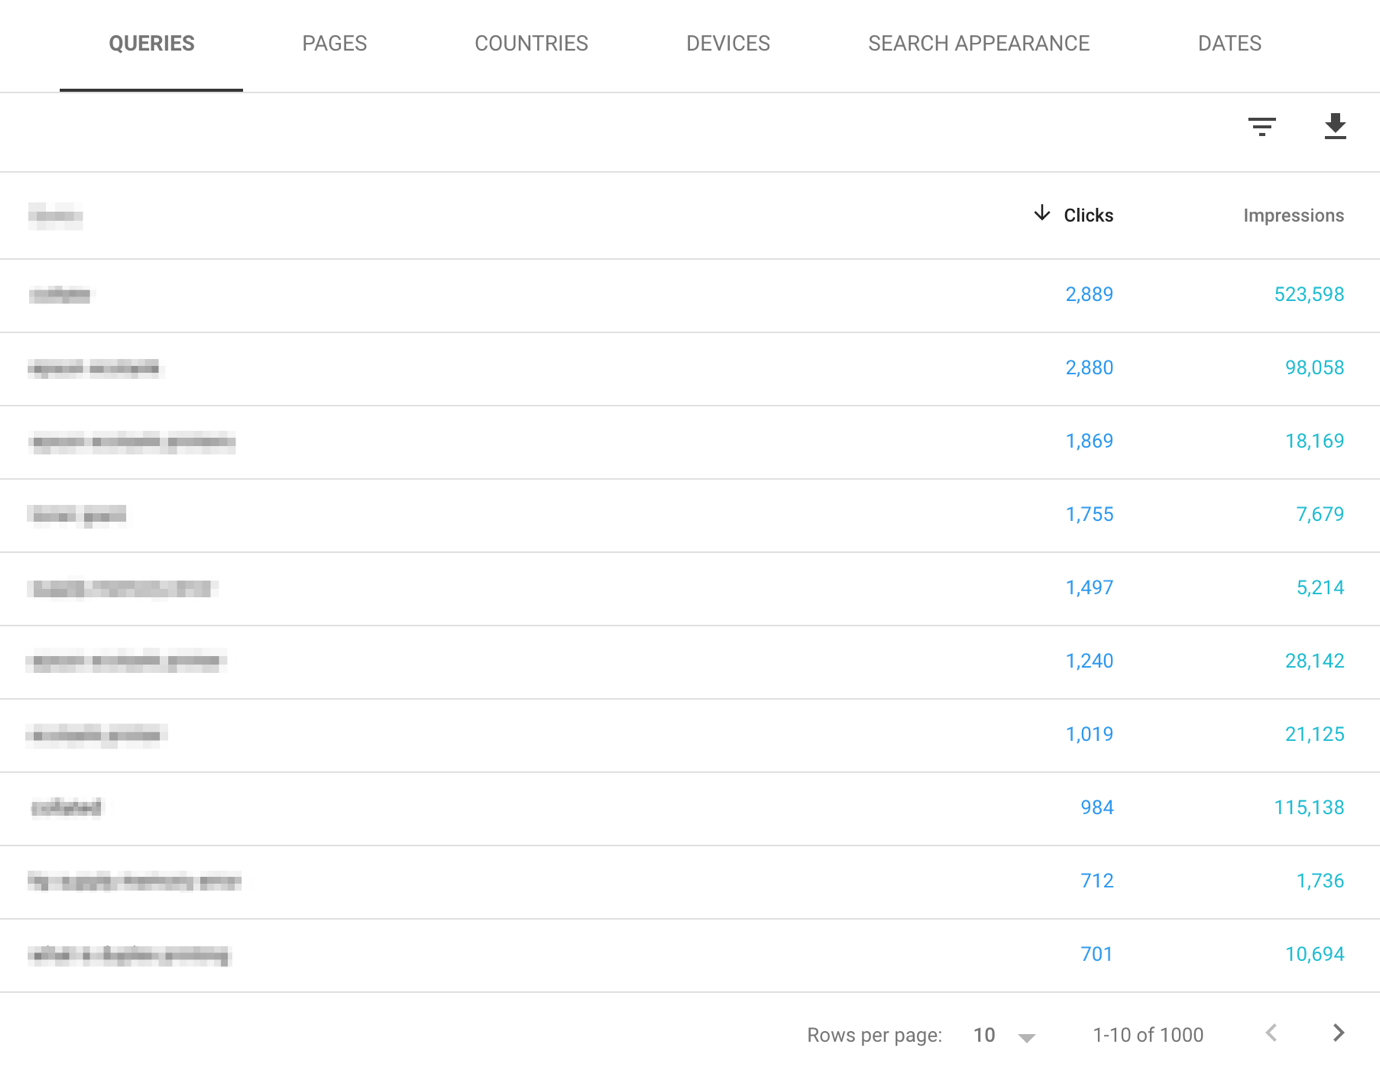
You also have the ability to click on each individual query (keyword) which then brings up a specific chart for that query (highlighting impressions, clicks, CTR and average position for the selected keyword) to give you an understanding of any fluctuations from a specific keyword across a defined date range. This is especially handy when trying to justify your content efforts on targeted keywords.
Coverage report
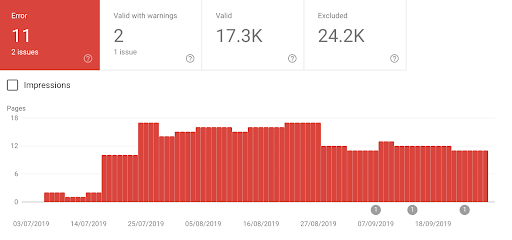
Within the Index section of GSC is the coverage report which gives an indication to any coverage/indexing issues Google is experiencing with your site. This report allows you to highlight the number of errors (pages that couldn’t be indexed), warnings (pages that have been indexed but contain issues which Google is uncertain of), valid pages and excluded pages (those pages that the user has intentionally excluded from the index.
Why is this report important? Well, it lets you see exactly how Google is indexing your site and gives you suggestions as to the problem. In the example below, GSC details the following errors.
- Submitted URL has crawl issues
- Submitted URL seems to be a Soft 404
- Submitted URL not found (404)
- Submitted URL blocked by robots.txt
- Server error (5xx)
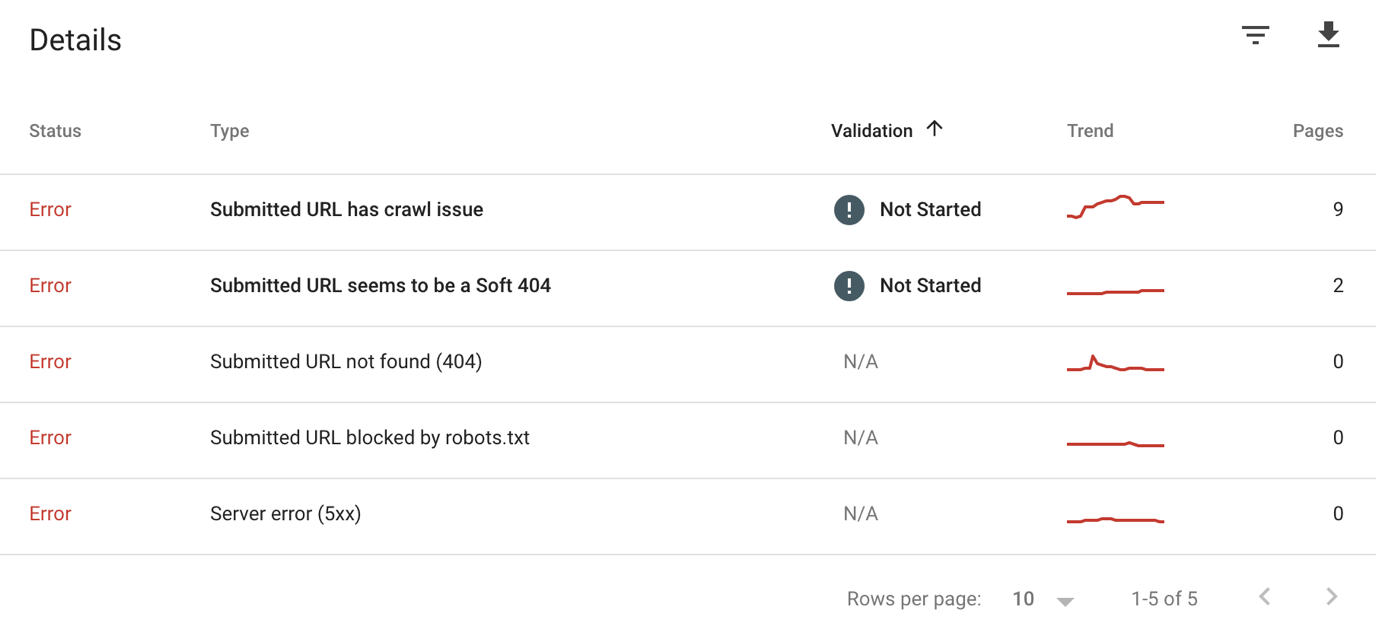
It is essential to understand any URL housing errors as this could lead to a loss in traffic (and therefore enquiries/revenue) to your website, whether that be from pages not-knowingly being not indexed (not appearing within Google Search results) or them appearing within the Google results when they shouldn’t – the coverage report will give you this insight.
Within the report, you also have the ability to validate each fix and submit these to Google. To do this, click on each specific error within the details table and click ‘validate fix’. This will send a request to Google to re-crawl the page.
Sitemaps
The sitemaps report is a feature within the updated GSC and, ultimately, is an easy way of submitting your sitemap to Google. A sitemap is a file that provides information on your site structure and in the instance of Google, shows Google how to crawl your site, highlighting the relationship between content and pages so that Googlebot can better understand the hierarchy of your website.
GSC being the ever-useful tool that it is, not only lets you update your sitemap via the sitemap report, but similarly to other reports mentioned in this article, it will also highlight any existing errors with submitted sitemaps – you can find this within the sitemaps > submitted sitemaps.
Note: The sitemap report will only show sitemaps that have been submitted using the sitemaps report.
URL inspection tool
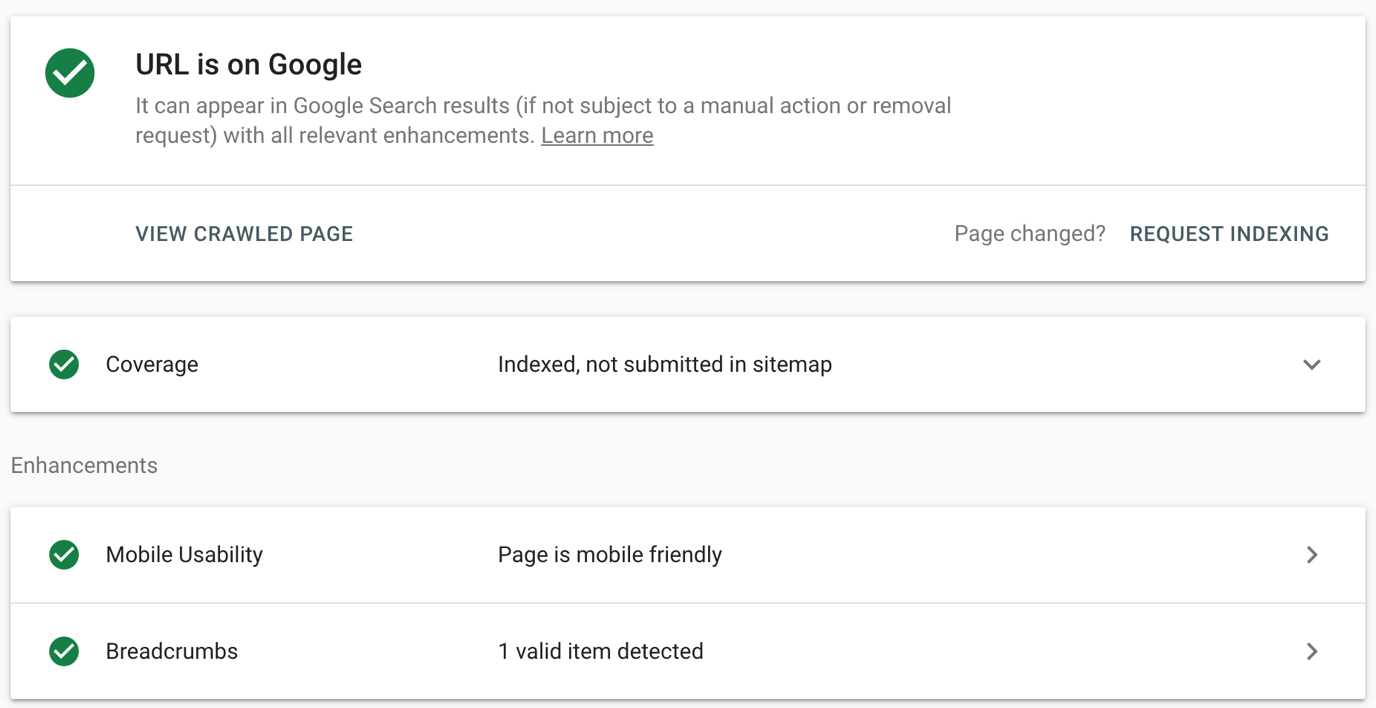
The URL Inspection tool allows you to enter any URL and inspect this as Google would. This tool will identify if the page is indexed (if not you can request the page to be indexed), if the URL is submitted to the sitemap, as well as if the page is mobile-friendly and whether breadcrumbs are correct (this will allow for rich results).
You can click on each drop down arrow to open the full report and understanding more about your chosen URL.
Links
The link report allows you to see the total number of external and internal links as well as the number of links (both external and internal) to all of your site’s pages. This is useful when highlighting areas of improvement and whether certain areas of your site are in need of backlinks to enhance SEO – you can change the filter on this report to from highest number of links or fewest.
Within the world of SEO, backlinks provide an indication to Google of the trustworthiness of your site's content, and therefore links are key when trying to increase the rank of your site. This tool is a great resource to show you where you’re lacking backlinks across your website.
Further to this, you can identify pages that aren’t being internally linked to from within your site for improved internal linking. Internal linking is key to be able to distribute the equity from your referring domains across your website and to key pages that you want to rank. You’ll be able to identify these poorly linked-to pages and improve upon them to increase your SEO performance.
The report also gives you information on the top linking sites to your domain as well as the top linking text which can be useful for your backlink strategy, highlighting those websites you may wish not to target.
Manual actions
GSC will show any active manual actions and potential security threats, including pending manual actions and allows you, as a site owner, to request a review. Essentially, this report is how Google communicates with site owners and provides information on why any manual actions have been taken.
I would recommend always checking this area of search console to be absolutely sure that Google is ‘happy’ with your digital platform – naturally, if you’re SEO and content efforts are in-line with Google’s best practice then you have nothing to worry about, but it’s better to be safe than sorry!
Mobile usability
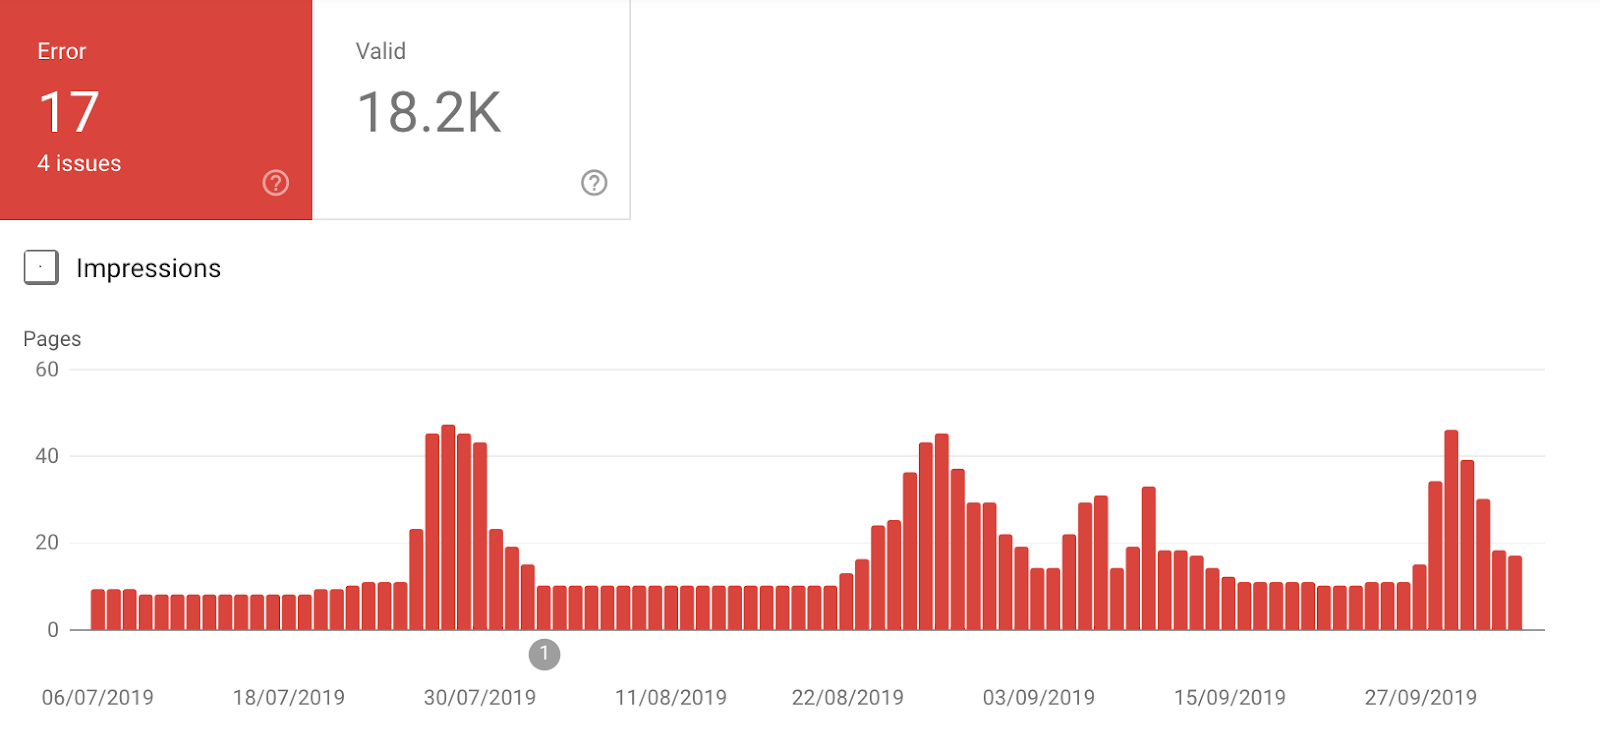
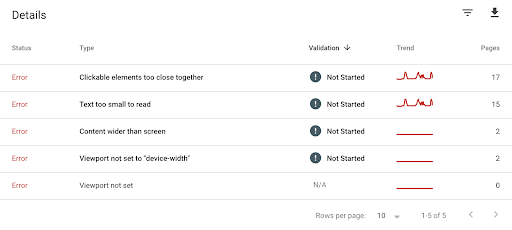
The mobile usability report highlights any errors or mobile usability issues that are specific for users accessing your site via mobile devices. This report, as like many of the others mentioned above, will give you a chart across a given date range indicating the number of errors for any given day, but will also give you a description of the errors that are being flagged. In the instance below, we can see that GSC is identifying clickable elements being too close together, readability issues, content formatting issues and recommendations for viewport (this tells browsers how to adjust the page to best fit different screen sizes).
This section of the report is especially useful for SEOs and developers as it allows you to identify and address key aspects of your site that are impacting upon your mobile users and, more importantly, how to improve upon this.
With Google now predominantly indexing the mobile version of sites first, there has never been a more important time to ensure your mobile users experience is the best it can be.
Conclusion
We hope the above gives you a little insight into the use of Google Search Console and the key reports used to help improve SEO measurement. The best way to understand GSC is to dive right in, take a look at the different reports and have a play – this will get you familiar with the structure of GSC and the data you can find/use to monitor your performance effectively. Matching the reports up with your KPI's, which we discuss over on this blog post, will help you prove that all important ROI.
No matter whether you are new to SEO or experienced in the field, GSC should be a tool you utilise on a weekly basis to understand your website trends and performance. You’ll find data here that isn’t stored anywhere else and better still, it’s completely free!
Stay in touch with the Zazzle Media family
Sign up for our monthly newsletter and follow us on social media for the latest news.