
The post below is a transcript from my BrightonSEO talk and covers a very specific area of content planning > content flow and covers off what it is, why it is important and how you can measure and test its effectiveness...
Over the past few weeks I've been speaking a lot about content planning and strategy and that process has forced me to think in much more detail about my time as a journalist and magazine editor and the lessons learned from that time on the front line of print content creation, delivery and distribution.
As part of that process I have enjoyed many conversations with old colleagues and friends that still work in that world today to refresh my own memory of the best ways of creating valuable audiences with content.
It has led to many changes here at Zazzle Media in terms of how we plan, strategise and measure content creation and curation and today we want to share one of our latest processes for a very specific area of content strategy.
Content Flow Visualisation
Those that attended BrightonSEO will have seen me run (quickly) through this but here I wanted to capture the detail in a post for a wider audience to make use of our process.
So, what is content flow and how do you affect it?
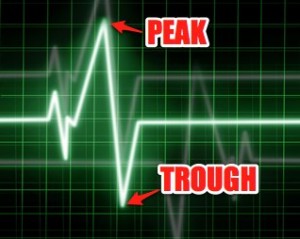
In simple terms you should think of your content schedule as a piece of music; and every great score has peaks and troughs, moments of calm and moment of crescendo. A content strategy should be exactly the same.
What you need to create such ‘flow’ are big and small ideas that correctly aligned create crescendo and periods of consistent but less ‘shouty’ content surrounding them.
Think about the TV schedule as a great example of this. Schedulers will choose to run a series like X Factor once a year and will surround it with a few days or weeks of ‘normal’ content in order to maximise its impact when it runs.
To achieve this you need two basic types of content:
1. The Regulars (the troughs)
While they may be explained as 'troughs' Regulars are a critical component of any strategy as they are the daily/regular blog posts, quick fire list pieces etc that you put out every day to feed those people closest to your brand. Those evangelists will feed off this and keep your brand 'visible' consistently.
Another role the smaller stuff performs is that of making the peaks, or big bangs, that bit more impactful. You have to have small to appreciate large, after all.
Examples of regulars might be a series of Top 10 Best Ever..., or a regular Q&A feature; content that is not to strenuous to put together but still exhibits your core expertise.
They also buy you time that you can invest in the bigger content ideas that are...
2. Big Bangs (the peaks)
Big bangs are simply put a ‘Big Idea’ and one that can be turned into an annual ‘event’ should it prove to be successful. The absolute key here is to not over commit in this area. Not only does it make it harder to deliver well but doing too many large content pieces can dilute their impact also.
Examples of Big Bangs may be X Factor on ITV or FHM's High Street Honeys - both are content that are iterated and reinvented each year and have become brands in their own right as a result.
The Planning
The ideal is the create something you can build a brand around and run annually iterating until it gets larger and larger.
The planning process should facilitate the creation of both of these distinctive content ‘types’ and while this post is not a content planning 101 (but this one we wrote for SEOMoz is!) you should think about structuring brainstorming meets to capture both.
The process for a single channel is inherently a simple one: create a content planner that captures both small and big content ideas and plan to intersperse those Big Bangs with lots of smaller Regulars.
The key to the success of such an approach is to ensure that this approach is then replicated across each of your digital marketing channels.
And the coordination of that is where our secret sauce comes into play…
Content Flow Visualisation
What are concerned with is understanding how to plan to get content flow right across multiple channels and to do that we have made use of a simple online chart tool that makes it REALLY easy to check your cross-channel content strategy.
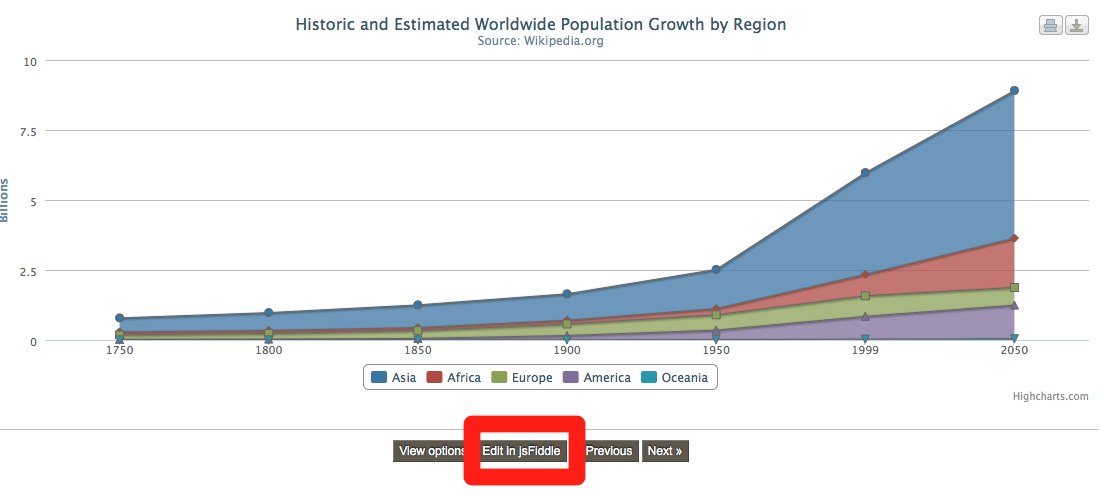
Highcharts.com is an open source chart resource used by several SEO software businesses to visualise data in an easy-to-digest way.
It is therefore ideal for use as a tool to help understand content flow and below is an example we created for Zazzle.
Step-by-Step:
Go to highcharts.com and navigate to the stacked area chart option in Highchart demos.
Click on the JSFiddle button and you will then be taken into a simple user-friendly back end, where you can edit the chart.
We use the Y axis to plot time spent in hours on the content. This gives you a great view on how ‘big’ it is as more time on creation and/or marketing usually means it is a much larger piece.
Along the X axis we then plot time and this can be hourly, daily monthly or even annually is you wish.
You can then use each line to plot content flow for each channel: social, blog, content marketing channel etc.
What you end up with is a clear view on where your peaks and troughs are relative to each other. This is valuable in spotting period of inactivity or periods where you may be trying to do too much at once also.
Should you spot a ‘flat area’ like we have you can then move scheduling around to better organise your content.
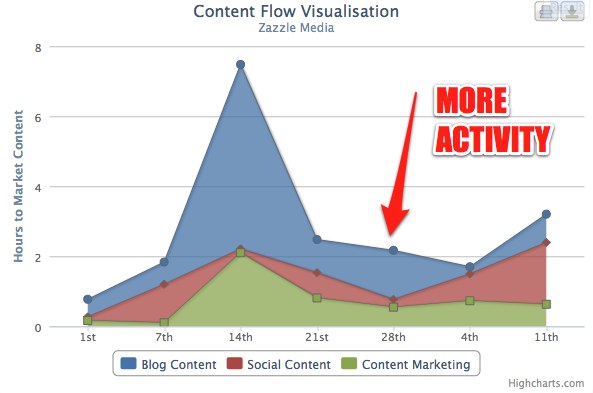
It is a quick and dirty way of helping you to understand how well you are orchestrating your content flow across each of your key channels enabling you to fix areas on inactivity, or even tone down over activity to create differentiation.
If you found this post useful, you might like to take a look at the content marketing strategy services we offer at Zazzle Media which can help you to achieve great results from your content output.
Stay in touch with the Zazzle Media family
Sign up for our monthly newsletter and follow us on social media for the latest news.


