
This blog post should serve as a great introduction to the most important reports within Google Analytics you can use to spot optimisation opportunities.
For those looking for some quick fixes I’ve included some of those at the bottom too. However, the data-first approach detailed in this post will help provide insight long after a list of best practice fixes.
1. Review your site on non-standard browsers and devices
Firstly, I would always recommend reviewing non-standard browsers and mobile devices to ensure you’re not leaking money through bugs and design issues.
Typically everyone in the office will be using the same web browser, so it’s very easy to get tunnel vision, testing every new release on Chrome and ignoring the fact that other browsers still represent 37.8% of the total browser market share.
To spot potential money leaks, fire up Google Analytics and go into the mobile report which can be found by following the below navigation:
Audience > Mobile > Overview
You’ll be greeted with the following report:
(For reference I am using the Google demo account which is using data from their merchandising store).
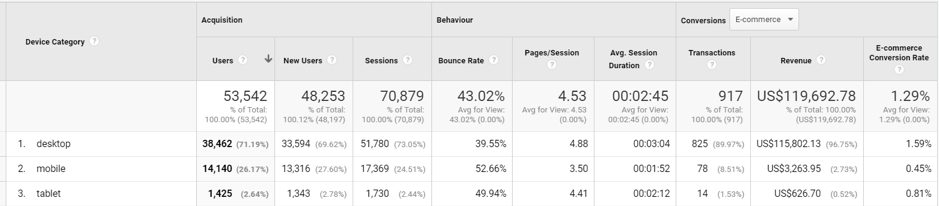
I’d recommend checking the data here first to get an understanding of priorities with which to dive into further. Make sure you’re using a long enough data range to get a meaningful amount of data. I’d recommend looking at a period where we’re seeing at least 50 conversions across desktop and mobile devices.
As we can see, the website is receiving the majority of their traffic from people on a desktop computer, so you might be forgiven for thinking that desktop is our main focus. I’d always give the data some context in the terms of trend over time, so compare your data year over year to see the estimate moving forward.
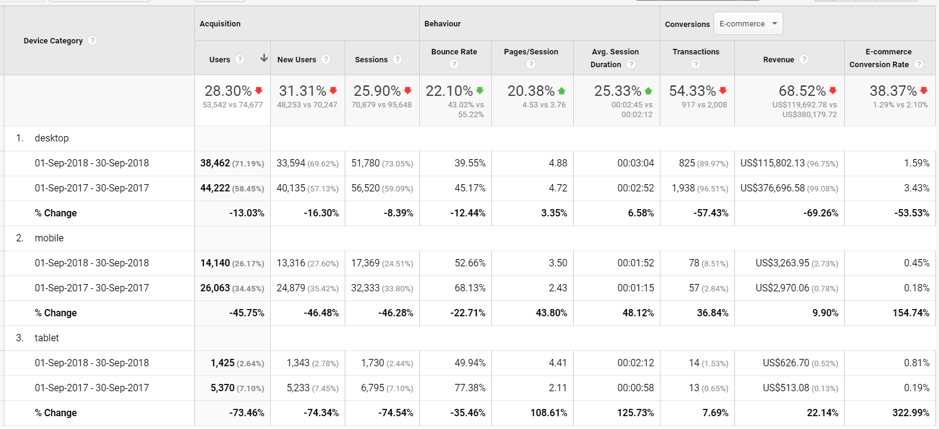
Here we can see that overall performance is down - not good! For the sake of this example I’m going to ignore the massive drop in conversion rate year over year, but if you’re looking at a report that looks like this, I’d obviously immediately begin investigating this issue. Is it due to any changes we’ve made to the website? Have we lowered our investment in a particular traffic source? Is there greater competition now? There are so many possibilities for this. In order to keep this focused we’ll ignore the overall performance drop and just focus on devices year over year.
The trend actually shows that desktop is gaining popularity. When previously it only had 50% of the share, it now has 75%.
This is obviously an unusual trend as we’d expect to see mobile growing, but let’s run with it for the sake of this exercise.
Next up, jump into the browser report which can be found by doing the following navigation:
Audience > Technology > Browser & OS
You’ll want to ensure you’ve applied a filter for the relevant platform you’re reviewing. Here’s what the report looks like for desktop devices on the Google merchandising store:
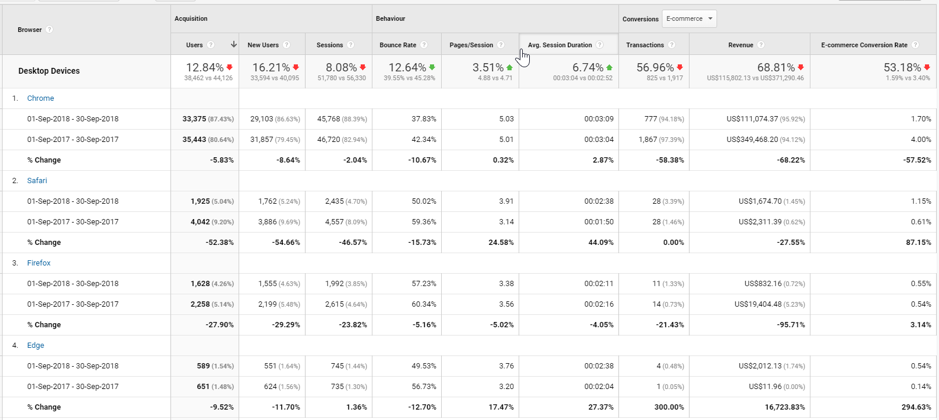
Can you see which devices stand out from the above data? Both Firefox and Edge’s conversion rate is way down compared to the average. This is clearly a cause of concern that should now be investigated.
Clicking on the browser will generate a report on the browser version which will look like this:
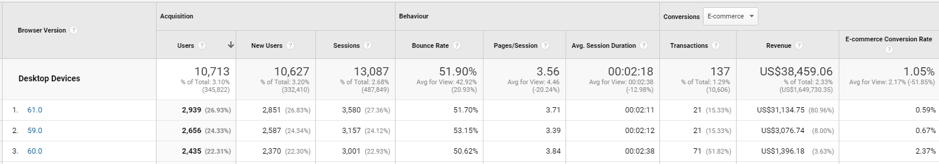
Here we can see that Firefox version 60 has performed quite admirably. However, 61 has fallen off a cliff.
Clearly, something that was working in 60 but has broken on 61. At this point we need to do a walkthrough on the site using both browsers. Has something changed? Is some functionality not working properly?
We’ve found one thing to investigate, but can now go away and review Edge as well. Then check mobile and see if you can spot anything there. How about mobile devices, or screen resolution? By going through all these reports we can start to gain an understanding of how well our website works across different devices. We can then work towards fixing the ones which will have the biggest impact on performance.
You can build a business case for any development fixes by using the below method:
- Take the difference in conversion rate between the offending issue and the overall average.
- Then compare the traffic trend year over year to anticipate future traffic levels.
- Finally, using the anticipated traffic levels, estimate the number of additional conversions you will receive should you improve the conversion rate to the overall average. You can then multiply this number by your average order value to put a revenue number on it.
2. PageSpeed
If you’re not prepared to make a fast site, you’re not putting yourself in the position of your customers.
In 2012 it was estimated that Amazon would lose $1.6 billion in sales from taking a single extra second to load. People are too impatient to wait for a slow site. On top of that, PageSpeed is a ranking factor for SEO. Google doesn’t want to frustrate their customers sending search traffic to a slow site.
So Google has invested heavily in page speed tools to make the web fast! There’s PageSpeed insights for a PageSpeed audit, open source modules for Apache and Nginx (which you can install on your server for automatic speed optimisation on your site), Google Lighthouse performance report within Chrome dev tools and the mobile speed test (to give traffic projections for speed improvements).
I’m going to show you how to use the Google Analytics report which can be found by navigating to the following:
Behaviour > Site Speed > Page Timings
I like to begin by auditing our top landing pages, by most popular platform. So, for the below screen grab I have set primary dimension to Landing Page and added a Desktop Only segment.
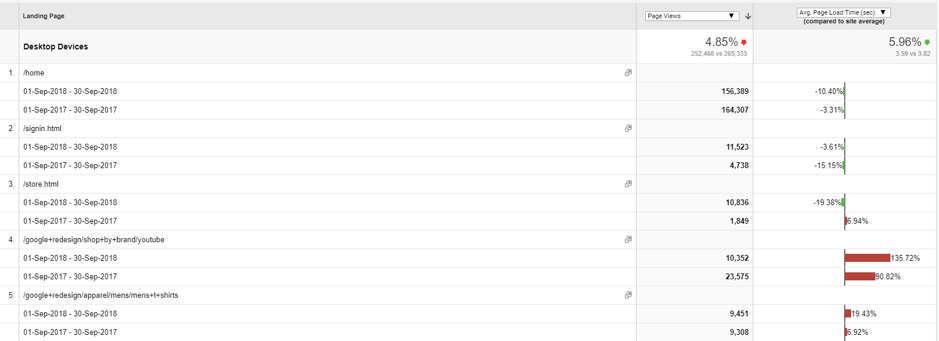
We can immediately see that the YouTube landing page is an area of weakness for the Google merchandising store. This data isn’t quite complete on its own, so I’d compare this to the transaction, revenue and conversion rate data provided within the Landing Page report, so be prepared to flick back and forth to ensure the page is important from a revenue perspective too.
Let's say the YouTube page is leading to a significant amount of conversions. We’d then conduct a full speed audit on the page for areas of opportunity. We’ve already written a comprehensive guide to improving your PageSpeed guide here, but the top level areas to focus upon are:
- Compression
- Minification of HTML, CSS and JavaScript
- Redirects
- Caching
- Server Response Optimisation
- CDNs
- Image Optimisation
- Requests
I’d always recommend working through priority landing pages, spotting opportunities then working on your page load time. It’s important to segment your reports by devices, especially if you’re using a dynamic or dedicated mobile website.
3. Start back to front
Whether you’re buying a product or signing up to a service, every website has steps you have to complete in order to convert. Creating an understanding of this journey within Google Analytics can highlight traffic leaks which are preventing customers from converting.
Just making a few changes at the bottom of the funnel can massively affect your revenue, and changes are more easily measurable.
You can configure a useful funnel report in Google Analytics by configuring it when you set up your goal. To do this, navigate to the following:
Admin > View > Goals
You will be able to configure the funnel report within Step 3. You can then enter the previous steps the user must follow in order to complete your goal.
It will look something like this:
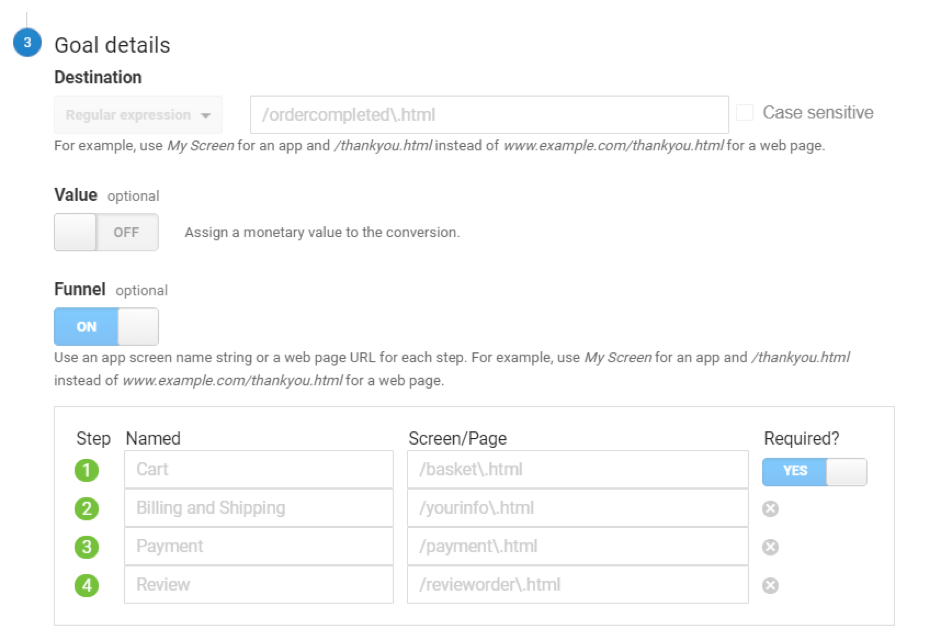
Make sure the data provided here is accurate or the analysis will be useless. Make sure every stage of the funnel has been configured.
Once you’ve done this, you’ll be able to get a visualisation from navigating to the following report:
Conversion > Goals > Funnel Visualisation
The report looks something like this:
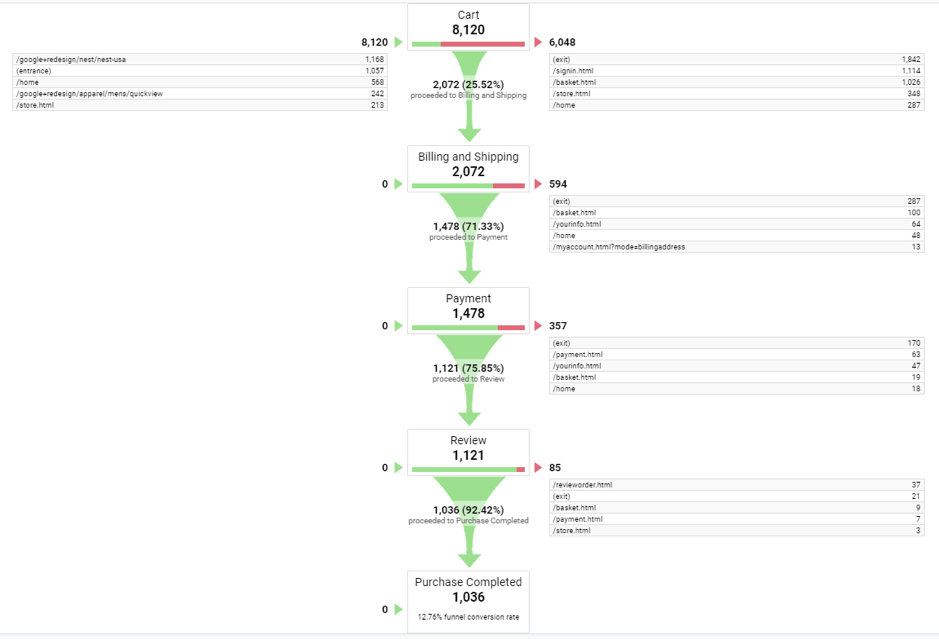
This report is very useful for spotting drop offs, and we can immediately see a big drop off on the cart section of Google’s merchandising store.
At this point you can then audit the page itself and ask the following questions: what are we asking the user to do on this page? Is it clear? Is there any friction? Are there any technical issues? Are we demonstrating trust?
It might not be immediately clear what the cause of the issue is, but in our example just a 5% increase of users from cart to billing would see an additional 182 transactions. Here we can see the instant value to auditing and improving the order journey, where just small improvements can lead to big wins.
Funnel visualisation is a fantastic way of spotting which areas to focus upon and can be expanded to view the entire site funnel, from initial awareness traffic all the way to conversion. With greater expansion comes increased data gathering and analysis, which takes it away from the realms of quick wins so I’ll leave this for a later blog post.
4. Fix no-brainer UX issues
Everyone’s been there; links that are too small to be clicked, intrusive pop ups and ads that prevent you from navigating the site, to non-standard designs that find you asking, ‘What am I supposed to do next?’ If you’re a web user there’s no doubt that you’ve felt frustration on a website before that has held you back from converting.
Start off by fixing no-brainer UX issues. Functionality or web design issues which are causing big drop offs on your site.
To diagnose these, navigate to the following report:
Behaviour > Site Content > All Pages
Here I’ve got my Desktop Only segment applied. I’m using the comparison tool to filter by number of pageviews and exit rate to get a handy report that visualises what the exit rate of the most popular pages is.
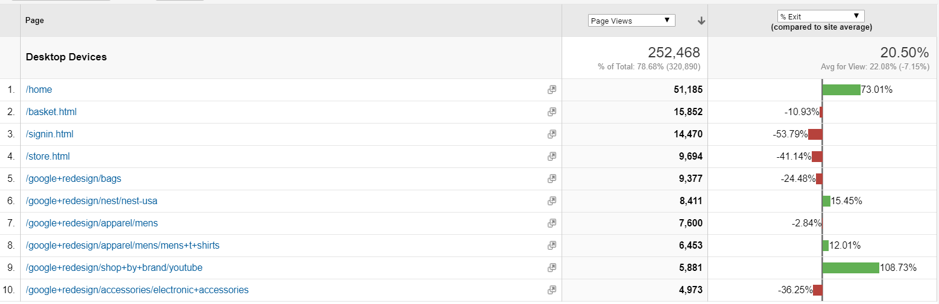
Quickly auditing the above pages for technical issues, we hit a 404 page on
https://shop.googlemerchandisestore.com/google+redesign/accessories/electronic+accessories:
There are a couple of things we can do here - redirect the page or make the 404 page more helpful through an explanatory message and some internal links back into the website. Testing these options against each other is recommended. We’d also want to audit how people are navigating to these pages and make appropriate changes.
Once you’ve reviewed all the top landing pages for obvious issues you can do a full site walkthrough across multiple devices and browsers to see if there is anything you might have missed.
Once you’ve exhausted these, it’s then time to start building a comprehensive profile of your audience. I wouldn’t make major design or content changes based solely on the information found within Google Analytics. This should be informed through customer profiles which have been crafted using real data from as many sources as you can: reviews, customer surveys, live-chat, user-experience testing and audience data from Google Analytics.
5. Bonus Tips
The below CRO quick fixes don’t require Google Analytics to diagnose. They are best practices we’d recommend are applied to most websites.
Use Reviews
Reviews are a great form of social proofing which helps build trust in your site. Make sure your reviews are genuine otherwise they can act in the opposite way!
Optimise Images
Make sure you use high-quality imagery, and as much of it as possible. For ecommerce sites, having large-sized images on category pages helps grab the attention, then use multiple angles and variants to help them make up their mind. For lead-generation sites, nothing kills trust like stock imagery. Avoid it at all costs.
Use clear CTAs
Every page where you want a user to make direct action should include a clear call-to-action. This should stand out from the rest of the design of the page; use a unique colour and visual style, and test text to see which is more effective.
Make forms easy to submit
Forms are a massive hub of frustration so anything you can do to make it easier will improve conversion rate; auto filling address, removing unnecessary fields and ensuring any field headings are persistent. Finally, people will always make mistakes so be sure to display helpful error messages displaying specifically where and what is wrong - not just generic error messages.
Use live chat
You don’t need to spend time analysing how your customers interact with your site if you can talk straight to them. You might have the best website in the world, but some customers still might not be able to find the information they’re looking for. By providing livechat you’re giving yourself a chance to hold onto a customer who might otherwise leave.
Be transparent about cost
There is nothing more off putting than getting deep into the order journey and some hidden cost being added to the order. This is likely to scare off a large amount of your customer base which may have been prevented had you been upfront your customer about the cost at the start.
If you want help with conversion rate optimisation, have a look at our service page, or contact us with any further questions.
Stay in touch with the Zazzle Media family
Sign up for our monthly newsletter and follow us on social media for the latest news.