
When modelling it’s all about preparation, as the 6 Ps go – proper prior planning prevents poor performance, and it’s no different when attempting to gaze into a crystal ball and give an educated guess at what’s coming next.
Now, anyone can sit in front of their boss and say, “Yes, with me performance is going to fly!” with nothing at all to back this up but an ego and unflappable self-confidence. Where the real magic happens is having data and logic to back this up, and of course, a bit of self-confidence too.
So, with all the uncertainty in projections why should we put ourselves through it? There are a lot of reasons! Arguably the most important - for external parties especially - is that they can see their money paying off and they get a flavour of what’s to come. Especially when revenue is involved, they can see a clear-cut potential ROI.
Potentially, there are positives and negatives to this as they can be used for tangible KPIs which is good for measuring performance and both parties know what is being aimed for. But also, there are a lot of caveats to these targets, which we’ll come to later, and that could cause the figures to be out.
Another notable benefit of projections is that it gives you a top-level view of seasonality within the market. You can see the peaks and troughs your business goes through and while some may have been obvious to begin with, some may surprise you and need deeper analysis into why. The benefits of seasonal opportunity are endless, as you can apply it to all areas of your marketing strategy – you can link up with content creation to make sure relevant engaging content is being created at the right time of the year.
This next point is double-pronged and links nicely with seasonal trends. By using both seasonal trends and projections you’ll be able to see any inefficiencies in your business strategy. If your highest organic search month is August by far yet revenue is on par with the other 11 months, why is this? Why aren’t those searches converting? What can we develop to get those users further down the funnel?
In short, projections can offer you some worthwhile top-level insights which, coupled with seasonality data, could transform your business strategy going forward. So if you need to prove performance and ROI, then listen up. Let’s get stuck in:
Step 1 – Know your audience
The first question you must ask, is what are we going to model? What are the guys making the decision going to want to see? Sometimes they make it almost too easy and tell you what they’re looking for, but often you have to use a bit of initiative.
Getting to know the people you're producing projections for goes a long way. Are they numbers focused? When they’re speaking about the future partnership are they mentioning clicks, revenue, or both? Companies love numbers and your main contact may well be a digital marketer and know the language you’re speaking. However, every company loves seeing revenue projections and being told how much money you’re going to make them in the next three, six, 12 or 24 months so that’s something to bear in mind. The main reason companies love projections is because they then have something tangible to measure you against - so it’s incredibly important you make these targets realistic and achievable as well as impressive and easy on the eye.
Step 2 – Prepare, plan and organise
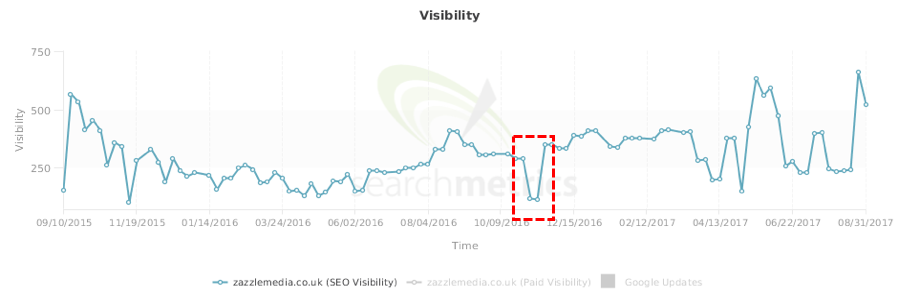
Look back at performance, have a clear understanding in your head of where the company is, and how they’re performing currently. The last thing you want to do is project the highest numbers the company has ever seen in month two through lack of understanding; remember realistic and achievable. Most SEO tools and software will give you performance data, your best bet is looking at them all and then hopefully telling a similar story - ahrefs, SEMrush and SearchMetrics all have good measurements.
1. Seasonal Opportunities
When modelling in any form it is important to identify a seasonal trend. All companies have them, and some will be more obvious than others. For example, a fashion retailer peaking in December just in time for Christmas. We will apply the seasonal trend later, but it’s important to have an understanding before projecting anything. Some ideas for seasonal campaign planning can be found here in this download for reference.
2. Identify Anomalies
When you’re looking at seasonal trends, identify anything that looks out of the ordinary. Seasonality will always play a part in a businesses' offering dependant on sector, but if the spike is abnormally high or low, have a deeper look. When it comes to setting KPIs this is an important caveat to point out to a client as you don’t want them asking, in six months’ time, the question why haven’t you hit that anomaly when it’s completely out of character to begin with. You may even have to adjust the projections when it comes to this month.
Step 3 - Keywords, keywords, keywords
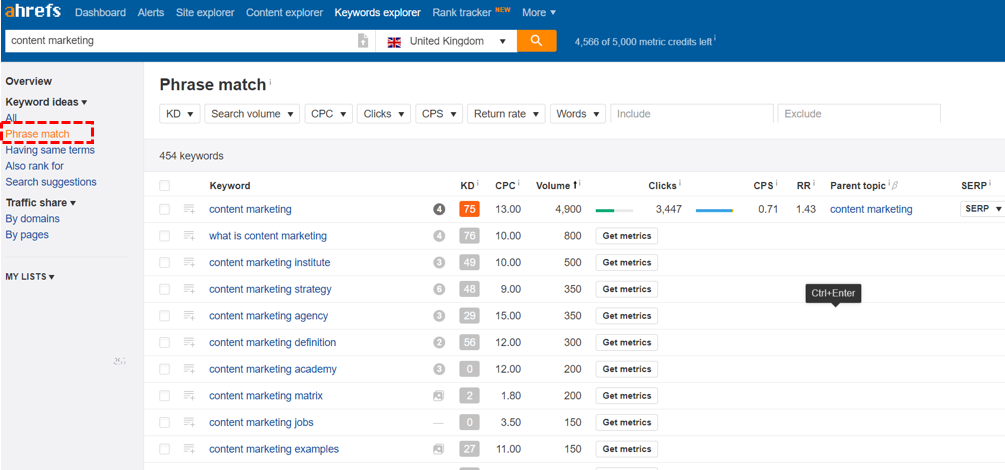
Now we’re aware of the seasonal trend and have a very top-level view of how the next 12 months will pan out in terms of peaks and troughs we can start getting stuck into the actual numbers. As with the large majority of data tasks, we start with keywords. We need highly relevant keywords with a decent amount of search around them. Again, dependant on how helpful they are they might make it easy for you and provide you with a list of all the keywords they want to target - great! But probably not. You can use ahref's keywords explorer to develop a good-sized list. Identify the main categories that the company is targeting, type that in, click ‘phrase match’ and you’re away.
Average order value (AOV) and Conversion rate (CR) are a must, the only way to really have these is via their google analytic profile or simply asking them. We use click through rate as a way of determining growth and estimating traffic. For example:
To find out the estimated traffic for a keyword with a search volume of 200 and ranking in position 4 we simply do...
Search Volume x Average click through rate = Estimate traffic
(200 x 6.03% = 12.06)
(I have included a snapshot of the average CTRs below for you).
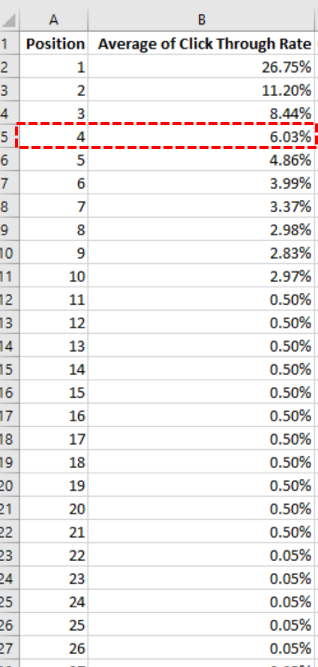
Click through rate is also helpful in enabling us to find out the maximum potential of a keyword which is great for prioritising keyword targets. For that we simply do the same sum but always multiply by 26.75%, which is the average CTR of a keyword in position 1.
Search Volume x 26.75% = Estimate traffic
(200 x 26.75% = 53.5)
Step 5 – Projecting organic
So, we’ve gathered everything we need, we have a good list of highly relevant keywords, we’ve got some jargon to make it as accurate as we can and we have a good understanding of seasonal opportunity along with any anomalies. The way we project here at Zazzle Media is based on an in-house spreadsheet which is full to the brim of formulas and matrixes so I’ll run you through a simplified version of what happens.
We need three basic bits of information to get us started - keyword, search volume and current position, so the spreadsheet knows where we’re starting. The spreadsheet then calculates how difficult the keyword is to change ranking for based on where they’re ranking currently and the search volume. The higher the keyword is ranking, the harder it is to move upwards as the competitors around are generally competing for it also. Although harder to move the reward is much larger. A keyword with a SV of 10,000 in position two will be getting an estimated 1,120 clicks whereas one place higher they will be getting an estimated 2,675 – that’s 1,555 clicks difference between one place. The other metric used by the spreadsheet to calculate keyword difficulty is search volume, the higher the search the more appealing and sought after by larger competitors.
This is why CTR and accurate metrics are so important to organic projections. The spreadsheet calculates the incremental positional growth of each keyword, multiplies by the appropriate percentage as per the average CTR, sums all the estimated traffic together each month and there’s our incremental projected traffic. It’s a very good way of projecting organic but you will need a bit of manual common sense involved here; in an ideal world you would get every single keyword to No.1 but realistically that’s probably not going to happen. Dependant on the size of your keyword set your incremental growth will eventually plateau out whether that is month five or month two.
Step 6 - It's all about the money
As already mentioned dependant on what your audience is looking for, you might have to also project some revenue. You’ve done the hard part projecting organic, getting down and dirty in the numbers and ensuring they have no odd huge peaks or any other issues. This is when your AOV and CR comes in handy for reliable numbers - time for some maths:
As an example, let’s use these as our metrics:
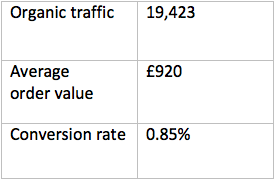
(Organic traffic x CR) x AOV = Organic Revenue
(19,423 x 0.85) x £920 = £151,888
By completing this for all projected months you then end up with a full year’s plan of organic visits and revenue. With a few simple sums, you can present this in any way you feel appropriate. Some prefer to hit the company with the big figure: ‘Over 12 months we will drive you an extra X number of visits, amounting to X amount in revenue’, whereas some prefer to give the breakdown, showing their hard work.
Step 7 - Let’s be really accurate
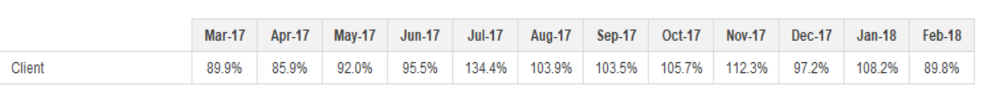
Now we have all the data and information we can go one step further and really show we have taken everything into account. Let’s go back to seasonality. By using a search volume software tool that can provide you with estimated search split across the 12 months, we can apply this to our numbers to look more accurately to the peaks and troughs a year has. Rather than continuous MoM growth, we’re looking for YoY also.
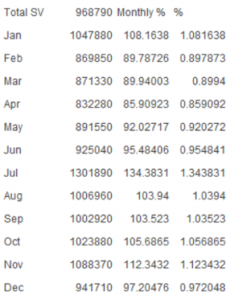
With our output showing us search volume month by month, we can use the total from all months as our total search volume, then take the result from each month as the search volume for that month. So now we have 12 months of search volume, all we do is divide the monthly search by the total search to give us a seasonal percentage.
Stay with me - finally, we just have to apply that to our projections. For example:
Projected organic traffic x seasonality percentage = seasonally accurate data
9,390 x 89.9% = 17,439
Step 8 – Caveats
We’ve worked hard to get these projections as accurate as possible, but there’s one thing that is out of your hands when projecting for a client - and that's their input. Especially when you have limited access to making changes yourself, you can develop all the category content, you can develop fun, informative on-page blog content, you can recommend any number of SEO fixes but if it isn’t uploaded and actioned when recommended you could miss the opportunity. With clients' buy in being a major part of a successful partnership it’s absolutely crucial when projecting that the client understands that these are best case scenario projections. It includes all fixes, all content, all recommendations actioned in line with the relevant timeframe.
The volatility of CTR is something that’s increasingly concerning when it comes to organic modelling, a recent study by Rand Fishkin of Sparktoro concluded that in the last two and half years no click searches have increased by 11%. The SERP is becoming very convoluted with SERP features and paid results owning more and more of the SERP real estate, between answer boxes, people also ask, paid results, FAQ schema, carousels, videos & more it’s incredibly hard to stand out and get that click!
SERP features use to be more dominant within informational and long tail search, but now commercial head terms are being populated by more and more SERP features meaning it’s having a direct impact on commercial landing pages.
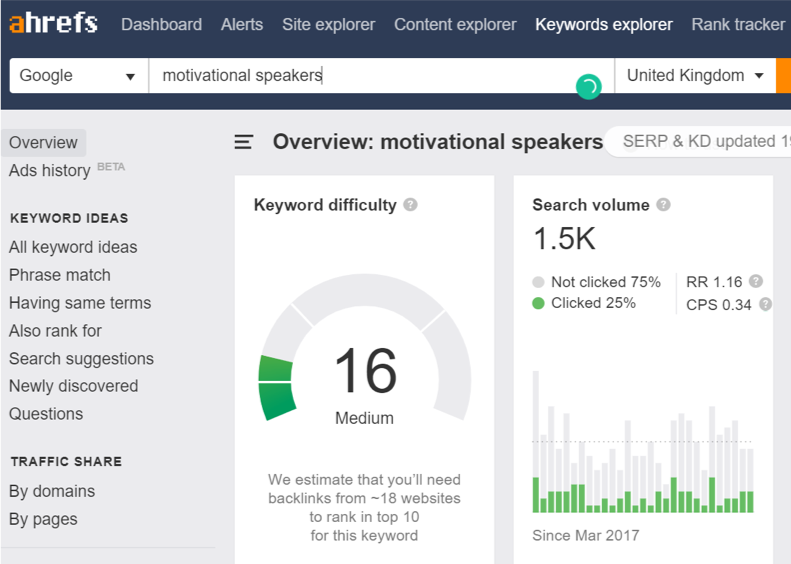
Especially when Google is struggling to understand the intent behind particular searches, take ‘motivational speakers’ for example, all of the ads are commercial and the top 4 organic results are commercial, but Google is treating it as informational by producing video content & a carousel of famous motivational speakers. The ambiguity of this search is meaning this ‘commercial’ search actually has only 25% of searches ending in a click. Using Ahrefs keyword explorer as a guide.
Google doesn’t want people on websites, it want’s people in the SERP where it can understand and control what it’s showing you.
You might be thinking, well that’s very interesting but what does that have to do with projections? Well, everything really! Generally, projections are based on incremental traffic based on search volume, ranking position and CTR. If the CTR is so vastly different for each SERP and even each specific keyword it can be incredibly hard to do.
Here at Zazzle we’re working with a new innovative way of projecting which includes a detailed breakdown of the last 2 years of Google analytics traffic and Google search console clicks & impressions. This takes into the actual real-life seasonal trends the site has seen and models on top of that using task weightings.
The answer isn’t stop projecting, it’s evolve and innovate the way you are doing it.
In the end...
There’s a whole bunch of reasons why projections are brilliant and why they could transform your business strategy, but it all comes down to one thing primarily – the manual intuition of the person inputting the data.
Marketing is about people on both sides of the desk. Without manually tooth picking your way through the output you could walk yourself into big trouble with clients and promising something hugely unachievable. Similarly, you could massively undersell yourself. Lastly, these steps aren’t just applicable to external clients it’s also a brilliant way to internally measure aspects, set KPIs, see inefficiencies in your process - there’s no reason why you can’t apply everything spoken about here internally.
But when you come to developing projections and attempting to gaze into that crystal ball, and prove ROI, remember above all else to:
- Know your audience
- Prepare, plan and organise
- Keywords, keywords, keywords
- Gather the jargon
- Apply seasonality to be really accurate
Finally and most importantly – make them realistic and achievable as well as impressive and easy on the eye!
Get in touch with Sam via Twitter with any questions.
Stay in touch with the Zazzle Media family
Sign up for our monthly newsletter and follow us on social media for the latest news.