It’s been a tumultuous year in terms of being a Google customer. By customer, I mean someone at the behest of Google’s products, not necessarily a user of their search engine. This includes their algorithm, Adwords, Adsense and of course the one I refer to in this post… Google Analytics.
When you look at the change in Google’s platforms over the past 2 years or so – penalties, PLAs, Google+ etc – GA has in fact remained relatively consistent. A UI change occurred earlier this year, yes, but I certainly feel it’s still the same GA we’ve always used, incrementally improved over time.
The thing with GA is that around 95% of sites on the web uses it. This means it’s likely that the insight you’re getting, they’re also getting. With this in mind I spoke to some leading digital minds and asked them what their tips and tricks are for GA in 2014 to gain insight over and above the norm.
This is a live post, so I’ll be adding more contributions as I receive them. If you’re interested in contributing then please get in touch by leaving a comment below the post.
Paul Rogers, from Buyagift and paulnrogers.co.uk, thinks 2014 in GA will be about getting around one of Google’s major 2013 SEO changes; the switch to 100% (not provided):
A lot of people are saying that the lack of keyword referral data isn't 'all that bad' - but for me, it's a disaster. We're currently doing a lot of TV advertising and tube advertising (for Christmas) and it's really difficult to attribute value to these campaigns without being able to look at branded searches (from organic), which is a big part of direct response success measurement.
We can get some insight through modelling our current organic data based on how people responded to last year's adverts (e.g. last year’s adverts generated x% increase in branded organic searches, so apply that % this year), but overall it's very frustrating.
I'm currently reporting on keyword impressions (AdWords is much better than GWT for this), clicks (through GWT, but the data is pretty poor), SEMrush keyword data (percentage of traffic), modelled retrospective data and obviously the landing page (which is the best data in the 100%-encrypted world).
Also, I've been doing more work on re-attributing retrospective not provided data to give us a bit more insight into which keywords have been generating traffic over the last 6 months (pre 100%-encrypted), specifically focusing on branded vs non-branded traffic. Of course a matching RegExp filter would easily have done this prior to 100%-encrypted, but now we have to be a little more creative!
I've basically taken lots of organic data from the last 18 months and done the following:
- Take all branded organic traffic and revenue data from GA, plus grab your total (not provided) traffic number too (from a pre 100%-encrypted time period, e.g. 2012)
- Subtract branded and (not provided) from the total to get non-branded keyword traffic for pre 100%-encrypted
- Add non-brand and brand together and get the proportionate percentage for each
- Apply this percentage to (not provided) and re-attribute the traffic to the two datasets
I then did this for each month to get an indication of how our branded traffic has changed for key periods of last year compared to this year - I was also looking to attribute growth in branded searches to offline marketing activity.
This isn't a concrete representation, but it's more data for reporting and understanding how users are getting to our website, which ultimately is what we want to know.
Next year, when I do more on this I will be modelling keyword data based on landing page and I plan on bringing in correlations between ranking changes and landing page traffic too.
Graham Charlton from Econsultancy.com thinks that, as Editor-in-Chief of a highly-trafficked, content-based site, his most valuable GA attribute is understanding how people are arriving on site, so content can be optimised accordingly. This is especially useful if you are a content publisher. Graham has previously also published a piece on GA dashboards here: http://econsultancy.com/uk/blog/62828-10-useful-google-analytics-custom-dashboards
This dashboard provides all the real-time stats I need at a glance. The traffic numbers tell me how we're doing at that moment. I have an idea of what traffic should be at various times, so I can tell if we're very busy or too quiet, and the sources give me a clue on where it's coming from.
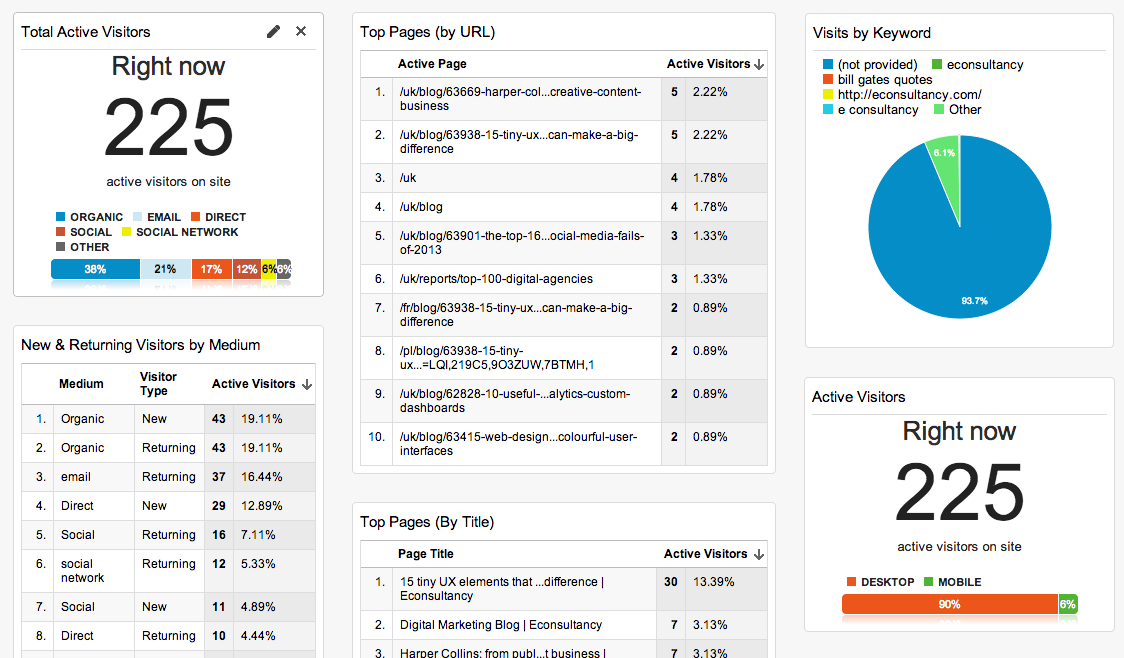
For example, a high portion of social traffic may mean that someone with lots of Twitter followers has retweeted one of our links. Top posts by page title is useful, as it will show a spike on a particular post. As for the (not provided) section, that's more there to lament the loss of keyword referral data. For us, it's been too small to be of any use for a while now.
How to set up the (not provided) filter:
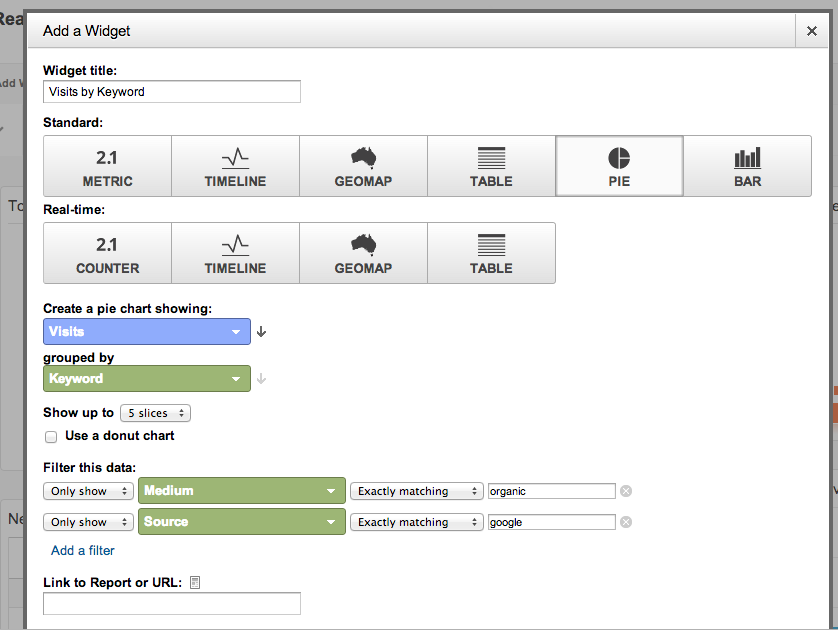
I should mention that this dashboard is based on one by Dan Barker - I've added a couple of widgets to it. The beauty of dashboards is that you can easily customise, add and remove. For example, I have a US one to measure our US traffic and top posts.
That said, dashboards are a form of analytics porn - it's fun to watch the numbers and charts moving, but there is more insight to be gained from longer term data, which is where custom reports are so useful.
Add Graham’s dashboard to your profile here: https://www.google.com/analytics/web/template?uid=sSe3fDn1T3SCo27LHD0hqQ
Sean Clark, from seanclark.com, sees 2014’s big GA tip as being focused on content, which Zazzle very much agrees with! Specifically, Sean’s dashboard looks at attributing revenue to an otherwise difficult-to-measure channel.
There is no question 2014 is all about content. It doesn't matter if you're doing SEO, Social Media or any other online activity, content marketing is what is driving it all. But demonstrating the value of that content can be difficult.
We can look at shares, likes, retweets and +1s but these are vanity metrics (although yes, they are becoming important to rankings) and they're not attached to business goals. Most businesses want to know if their content is driving revenue, and that's what I love about this Google Analytics custom report.
The Content Marketing Revenue Report allows me to demonstrate the real business value being generated by a businesses content marketing efforts and directly asses the ROI.
N.B. A minor edit is required in the filters for this report to get it to work with your website. Replace the current directory with the one where your content resides.
You can add Sean’s dashboard to your own profile here: https://www.google.com/analytics/web/template?uid=q2wTA0frQ9msW3TZPefRtQ
Troels Kjems from thinkdigital.dk believes that averages often lie and in 2014 we should be focusing on segmenting via the new GA demographic and interest reports.
A lot of our customers still haven’t enabled the “Demographics & Interests” reports in Google Analytics. This is something that we will be pushing in 2014, as the data on age, gender and interests of website visitors can provide valuable insights for our UX designers and consultants working with conversion optimisation.
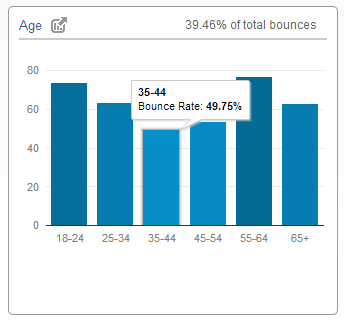
Many companies spend a lot of time on segmenting their customers, but when it comes to web analytics, most companies are still not very advanced in terms of segmenting their website visitors. Comparing bounce or conversion rates for male/female visitors or across different age groups can give you plenty of inspiration on which hypothesis to test in your next A/B test.
You can also use the information to track the predominant gender and age group that each of your social media channels attract. If you add e-commerce revenue or goal value to the equation, then it becomes really interesting.
Since it’s a five minute exercise to set up the tracking, there is really no valid excuse for not starting the data capture today – even if you don’t have time to take advantage of the data right now.
Sharon Hurley Hall, blogger extraordinaire and professional writer via sharonhh.com shows how a little research (like reading this post!) can uncover hidden gems, saving you the time of building your ideal dashboards from scratch.
One of my top tips for using analytics dashboards is you don't have to create them from scratch. I certainly don't. In fact, two of my favourite dashboards for providing insight into what's happening on my site come from Dashboard Junkie.
The first of these is their personal blogger dashboard which gives an overview of blog performance. My favourite feature is that the individual widgets are titled with the questions that people want the answers to, such as how people find my blog, how many readers I have, whether my audience is using mobile devices and who links to me. For even more insight, I change the default dates and use the comparison function to see how performance has changed within a given period.
My other favourite dashboard is their social media dashboard. With social media being such an important part of content marketing, it's instructive to track changes in the performance of your content on different social networks. And knowing which posts perform best on social media gives a good guide to creating new content. The best part of this dashboard is that it shows data hub activities by social network and action so I can track how often content is saved and shared via different social sites.
The best thing about these dashboards is that they won't go out of style. Bloggers and content marketers will always need to monitor content performance. So my top tip for 2014 is to grab these two dashboards and customise them so they show the data that's most important to you.
Moz Associate and owner of EvolvingSEO, Dan Shure, recommends maximising the link between GA and Webmaster Tools and also using GA shortcuts and exporting to ensure you're getting the most from the platform.
Using Analytics To Mine Webmaster Tools Data
I don't see a lot of people talking around using Analytics as a way to run reports on Webmaster Tools data. But there are in fact some pretty neat things you can do, despite being somewhat limited.
First of all, before doing anything you need to make sure to link Analytics to Webmaster Tools.
I have two tips around this;
#1 - Discover Keyword / Topic Opportunity
We can't just say "keywords" anymore so what I mean by keyword opportunity is really topic opportunity - the goal here is to find topics in which you are just showing the beginning stages of organic visibility - and many times reveal some surprised of topics you may not have thought of.
1. Go to Acquisition->Search Engine Optimization->Queries
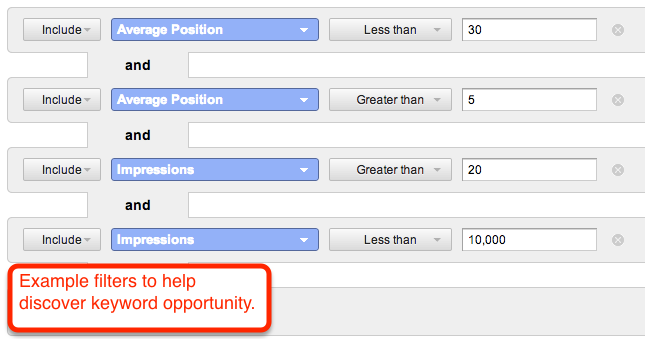
2. Here's an example of filters you can apply (which you can not do like this in Webmaster Tools)
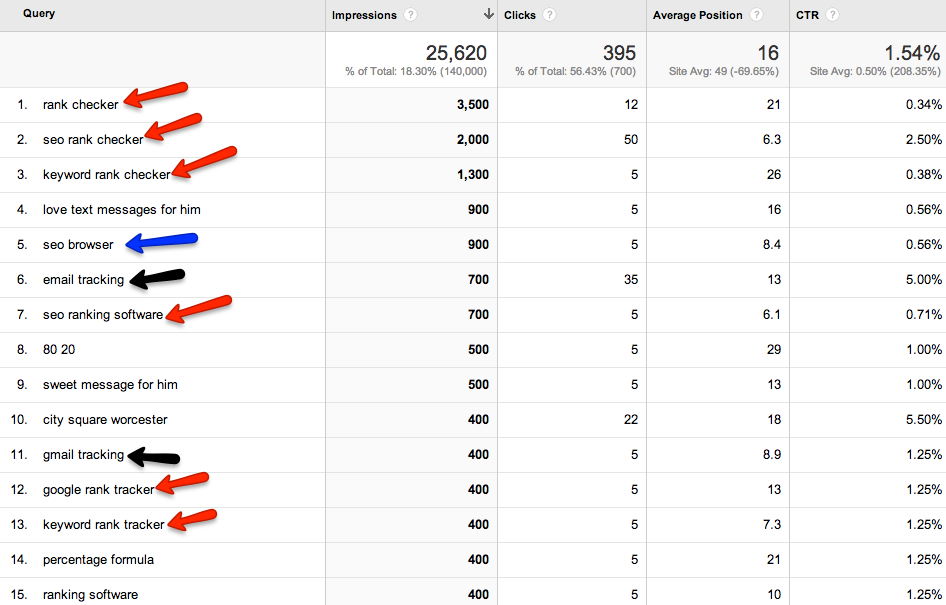
And you should get something like the following - my goal was to show mid-level impression keywords, ranking between positions 6-29;
I'm using my site as an example.
You can see some topic opportunities around "keyword rank trackers", "email tracking" "seo browsers" (tweet me @dan_shure if you're curious about the "sweet messages for him" thing - weird story)
#2 - SERP Performance By Keyword Bucket / Category / Topic
Topic, category, motif ... whatever we want to call it. The goal here is to use Webmaster Tools SERP data (which you can not get anywhere else) to see performance by a topic.
1. First, run a simple filter on the head keyword - like this;
The cool thing is you can use RegEx so if you're good with that you could find neat ways to refine your filters to suite your needs (check out the SEO's guide to RegEx)
You can (sort of) get this in Webmaster Tools but what I love next is the easy charts you can now show - which is great for showing to clients.
Impressions for last 3 months for "rank tracker" keywords;
Or Average Position (ranking) for last three months (which can be great for penalty diagnosis);
BONUS
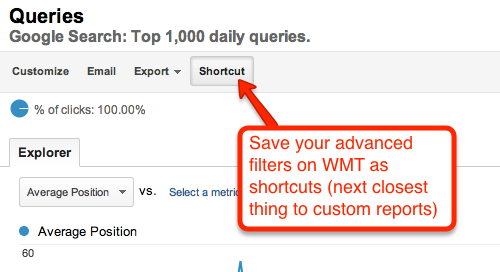
1. Use Shortcuts - so as noted there are limits to WMT data in analytics - most significantly the lack of segments or custom reports. but you can sort of get this with running filters and then saving them as shortcuts
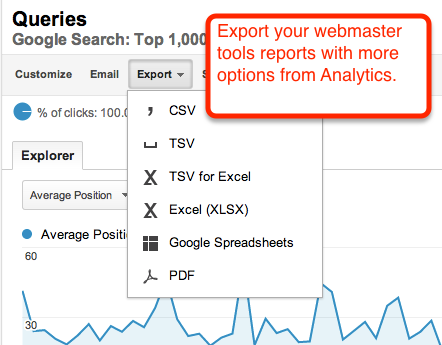
2. Use Exporting - I also make use of the better exporting features in Analytics to get my Webmaster Tools data - as you can send it to many formats, including PDF if it's a quick SEO report you want to send off to a client.
Ned Poulter, Digital Marketing Consultant, is particularly excited about Universal Analytics and gives some pro report tips too...
- Content marketing - Recognising top content on your site. As Troels, Graham and Sean have pointed out above.
- SEO - Interpreting keyword data after the move to 100% (not provided) and utilising Google Webmaster Tools data. As Dan and Paul pointed out above.
- Visit figures
- Conversion rate
- Number of transactions
- Total revenue
against certain devices or browsers. Allowing you to uncover low-hanging fruit to increase your conversion rate when your site isn’t compatible with certain devices or browsers. (Source: Craig Sullivan)
Personally, I really believe that 2014 will be about bringing content in-line with other marketing channels, in terms of assigning business benefit to it. The clear initial way to do this would be traditional above-the-line methods, however the digital element of content allows us to add online metrics into the mix to measure content’s effectiveness. This is especially important for social as we see more and more evidence of the conversion effectiveness of platforms like Pinterest, and also as the major social platforms continue to roll out their ad offerings.
This is why I personally like Doug Ridley’s approach. In fact, what Doug recommends is built into GA for anyone to use! My tip is to read Doug’s post here http://www.vtldesign.com/inbound-marketing/social-media/how-to-track-social-media-roi-using-google-analytics/ then customise the report he mentions, to really drill down into what % of your revenue can be attributed to which social platforms.
If you have any questions about the tips and tricks in this post please feel free to get in touch via the comments.
Thanks to all the contributors, plus Doug Ridley. Bookmark this post to watch for more tips and tricks from other leading digital figures.
Sign up for our monthly newsletter and follow us on social media for the latest news.




 Proudly part of IPG Mediabrands