This article will explore the most crucial key performance indicators (KPIs) that an eCommerce Manager should have in place at each stage of the customer journey - to measure the success of their campaigns and ultimately inform future strategies.
We'll break down the journey into five stages and suggest the most important KPIs for each of these stages.
- Awareness - how many people are seeing your brand or product line
- Consideration - how many of these people are engaging with your brand and in what way
- Conversion - how many of these interactions are leading to a sale
- Retention - who is coming back for more
- Advocacy - how many of your customers are acting as advocates for your brand and therefore introducing new customers to you
Awareness
This is an eCommerce Marketing Manager’s domain. How do you get consumers to find out about your brand and subsequently enter their consideration?
We initially need to establish how many people are being exposed to your brand in the first place. This will give us an understanding of where your audience is coming from, how best to target them and ultimately judge the success of your marketing efforts. There are a number of ways to measure the awareness of your market, depending on where you are investing marketing budget. But, for the sake of this article, we’ll focus on five metrics: Organic Search Ranking, Average Weighted Ranking, Site Visibility, Branded Search and Facebook reach.
1) Organic Search Rankings
This SEO metric looks at all traffic that’s earned, not paid. If your targeted audience is using a search engine to find a brand that offers a particular product then it’s hugely important that you feature as high as possible on the search engine results page (SERPs). After paid ads, Position No.1 (P1) is optimal and, as illustrated in the below graph, will give you the best chance of a high click-through rate (CTR).
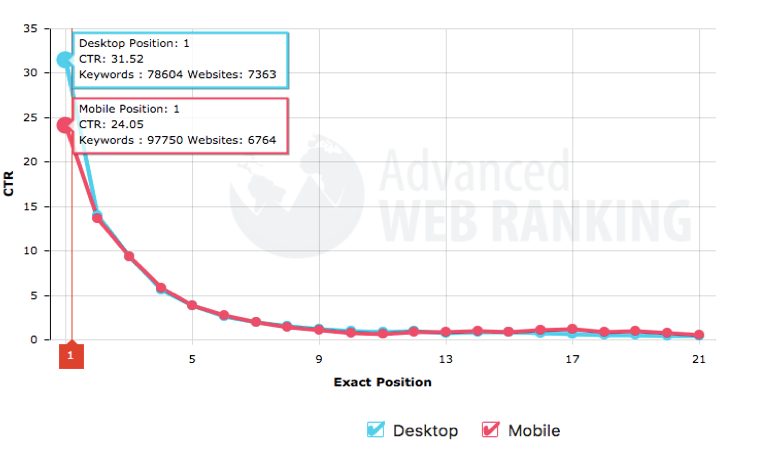
Not only does this chart show a clear correlation between a high SERPs position and high CTR but also that the drop between P1 and P5 is severe. With this in mind, your first KPI should be around rankings, namely that head terms from your keyword set are in positions 1-3 within SERPs.
2) Average Ranking vs Weighted Average Ranking
Once you have your individual keyword rankings, you’ll be able to work out the Average Ranking of your head terms. This is a more advanced way of looking at search volumes so can be useful to track. However, not all of your key terms will generate as many searches, and terms that get 200 monthly searches should be treated differently to those that get 20,000 monthly searches, depending on the intent of the consumer at that stage (ie. does this keyword indicate they just doing research on products, or are they ready to buy?).
So, in order to give more value to the keywords that deserve it (your most profitable keywords) we need to work out the Average Ranking Weight. The below table shows an example keyword set for a fashion house:
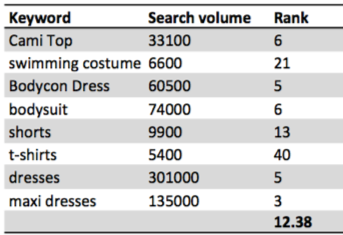
From the above keyword set we can see that ‘dresses’ has the biggest opportunity to drive more traffic to the site with an impressive search volume of 301,000. We can also see that this particular keyword is ranking quite well at P5. In contrast, we can see that ‘t-shirts’ has a relatively low search volume of 5,400 compared to the rest and isn’t doing very well in the rankings at P40.
With this in mind, if we were to work out the Average Ranking for the keyword set, it wouldn’t take into account the value of each keyword and less important terms may bring down the mean and thus give an inaccurate result. This, then, is where the Weighted Average Ranking comes into play, giving each keyword the weight it deserves. Below are three basic steps to work out your Weighted Average Ranking:
Work out the weighted value of each keyword:
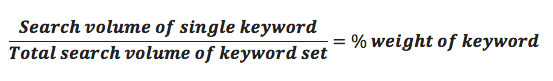
We now need to work out the weighted rank of each keyword. Here’s how:
![]()
Once we have the weighted rank of each keyword, we need to add them all together to find the Average Weighted Ranking:
The below table gives you all of the above for our example keyword set. The chart is an illustration of the potential difference between an Average Ranking and the Average Weighted Ranking:
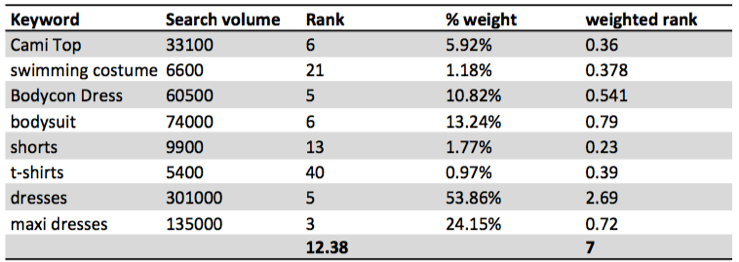
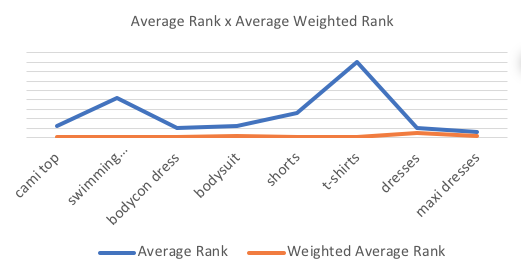
The above table demonstrates the potential difference between an Average Rank and Average Weighted Rank.
3) Site Visibility
Another metric linked to search rankings is search visibility – this is a score that gives you an estimated percentage of clicks that you can expect to receive based on your organic ranking position, across your entire campaign keyword set. There are many tools that will give you this information including Search Metrics. Another benefit of this metric is that you can compare your own visibility to a number of your competitors to gauge their performance against your own.
4) Branded Traffic
Within Google Search Console you’ll be able to find out how many people are searching for your brand name directly. This will give you an indication of the visitors who already have your brand in their consideration set, and have come to you directly. The level of this could inform you how much effort should be put into your brand awareness marketing, so that you can attract more people looking specifically for your brand, or indeed, how well your marketing efforts are doing overall.
5) Facebook Ads Reach
As of December 2017, there were 2.13 billion Monthly Active Users on Facebook and growing. It’s been calculated that the average time a user spends on the site is 35 minutes per day. No surprise then that the social networking site is often seen as a crucial part of a brand's marketing efforts. This said, it’s a saturated platform and the regular algorithm updates mean that marketers need to be sure they’re getting a good return on investment; Facebook Ads Manager Reports are a great way of tracking the peaks and troughs of your reach and engagement metrics, to see if algorithm changes have directly affected your results. There are a number of important engagement metrics to focus on within these reports to ensure your ads are targeting the right demographic and help you to understand what works for your brand and what doesn’t, thus allowing you to optimise accordingly. The main KPIs to look at here are:
- Impressions – the number of times your advert is on someone’s screen
- Reach – the number of people who saw your adverts at least once
- Clicks – the number of clicks on your adverts
- Cost per Link Click – the average cost per each link click
Consideration
For many marketing managers, this will be the most important stage to track, to understand how many people are visiting your store and what percentage of these are actually engaging with your brand. It can teach us a lot about the design, content and structure of a site. Within the consideration stage, there are countless areas of analysis to help establish the quantity and quality of people who are interacting with your brand. To simplify, we’ll break these down into two main areas; organic traffic and behaviour.
6) Organic Traffic
The most important KPIs here are simple – how many people are visiting your site, at any given time. Within Google Analytics a quick search can give you this data which can then be further analysed by comparing to previous date ranges i.e. WoW, MoM and YoY.
- Sessions – a single session is the period of time a visitor is actively engaged with the site
- New Users and Returning Users – the number of first-time and returning visitors to your site. This data will give you a sign on how well the awareness and conversion stages of your campaign are performing, respectively
In theory, the more people you have coming to your site, the better. However, if these visitors are coming to your site but leaving straight away, they aren’t of much value. We therefore need to delve further into the behaviour of these visitors in order to measure the success of your site; namely its design, structure and content.
7) User Behaviour KPI's
These measures will give us an understanding of your visitor’s level of engagement and essentially the quality of the traffic visiting your site. This, in turn, will give us an idea of the quality of your site.
- Bounce Rate – the percentage of single page visits. In other words, the percentage of people who visit your site and leave without any engagement.
- Average Session Duration – the average amount of time a visitor is on your online store. This metric, alongside bounce rate, will help you to determine how engaging your site is.
- Pages per Session – the average number of pages viewed during each session.
- On-Page Actions – Google Tag Manager will be able to give you information on how your users are interacting with your site by tracking the number of people who click on specific areas, for example, a call to action. This information may help you to optimise your Information Architecture.
Once you have this information you may decide to make changes on the site to optimise. For example, if your site’s bounce rate is high you may want to consider making changes to the design of the landing pages to ensure they’re engaging and user-friendly. You can find out more around this including tips and best practice in another of our blogs, on Conversion Centred Design.
Conversion
For most eCommerce managers, this is the crux of the journey. How many of the people you’ve got to the site are actually converting by making a transaction and subsequently generating revenue for the company? Key KPIs to track at this stage are:
8) Transactions – the total number of individual sales on site. It’s important to understand this as well as the revenue in order to calculate Average Order Value (AOV).
9) eCommerce Conversion Rate – this gives you the percentage of sessions that resulted in a transaction. You’ll get this figure by dividing the number of transactions by total sessions. This figure will feed back into the sales funnel as it’s crucial to help calculate how much traffic you need in order to hit certain sales targets.
10) Revenue – the total monetary value of all on-site transactions.
11) Average Order Value (AOV) – by dividing the total sales by the total number of transactions, you’ll get the average value of each individual transaction. You may have to do further analysis here depending on how varied your product range is. Knowing your monthly AOV will allow you to monitor and even influence trends and optimise accordingly.
12) Basket Abandonment Rate – this is the percentage of users who put products in their basket but don’t complete the transaction. Knowing this will help influence your follow up communications. For example, if you have a high Basket Abandonment Rate, you may decide to start sending out reminder emails i.e. ‘Don’t forget these items in your basket!’
Retention
Once a customer has completed a transaction it’s important that we continue to track shopping behaviour and get a measure of the general customer loyalty. This information will help to influence your post purchase marketing strategies and how you get customers back to the site.
A few of the main KPIs to look at here are:
13) Returning Users – this metric will tell you how many of your visitors are new to the site (that haven’t visited from that particular device/browser in the last two years) and how many are returning. A quick search within Google Analytics or a similar tool will give you this data.
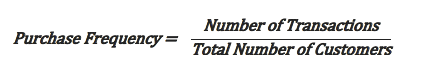
14) Purchase Frequency – this is the number of times the average customer makes a transaction from your site in a given period:
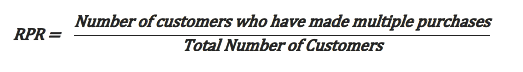
15) Repeat Purchase Rate (RPR) – in layman’s terms, this is the percentage of customers who have made more than one order. Tracking RPR on a regular basis (daily, weekly or monthly) will allow you to measure the success of any efforts you’re putting in to improve the loyalty of your customers i.e. email marketing, loyalty schemes etc. In order to work out your RPR you’ll need to use the following formula using data from your CRM:
Advocacy
It’s important not to forget how powerful your current customers can be in growing your audience. A 2017 article from Trust Pilot suggests that ‘people are four times more likely to buy when referred by a friend’. Providing they’ve had a good experience, your customers can be a very powerful and, compared to traditional marketing techniques, a relatively cheap tool in spreading awareness of your brand compared to Social Media, email and day-to-day conversations. Keep an eye on what your customers do after they buy:
Reviews – Both brand and product reviews are incredibly important for an eCommerce store by helping to get new people into the top of the sales funnel. A recent study by Podium, summarised by The Drum, shows how significant a 5 star review can be to your business. It reveals 93% of consumers say they are influenced by online reviews so much so that 68% of consumers would actually be willing to pay up to 15% more if they are assured they will get a better experience.
Social Shares – Social shares of your brand or product can act like free advertising for your eCommerce business. Not only does it allow you to measure how well your social marketing campaigns are performing, it can also give you an idea of how many more views you’re getting outside of your own following. It has been predicted that the average number of Facebook followers per account is 338. So, let’s say your post gets 50 shares, there is potential for your ad to reach an additional 16,900 people. Again, getting new prospective consumers into the top of your sales funnel.
Conclusion
There are countless ways to measure an eCommerce site’s performance, this article only touches on a small percentage of these, however, even with a few we are still able to see how important KPI setting can be for your campaigns success.
By breaking your campaign down into different phases, you’ll be able to focus on the most relevant metrics for each specific phase and ensure each is fully optimised. Doing it this way will also allow you to see any particular problem areas and make changes where necessary.
In short, understanding your key customer journey areas, setting the relevant KPI’s for each and reporting against these will allow you to track campaign success and influence future campaigns.
Stay in touch with the Zazzle Media family
Sign up for our monthly newsletter and follow us on social media for the latest news.