Online shop owners and eCommerce managers know the real importance of product descriptions and category content, but it is still often overlooked or not optimised. In this article we'll cover how to create eCommerce content, and measure the impact it has for your brand.
eCommerce content: Category content and product descriptions
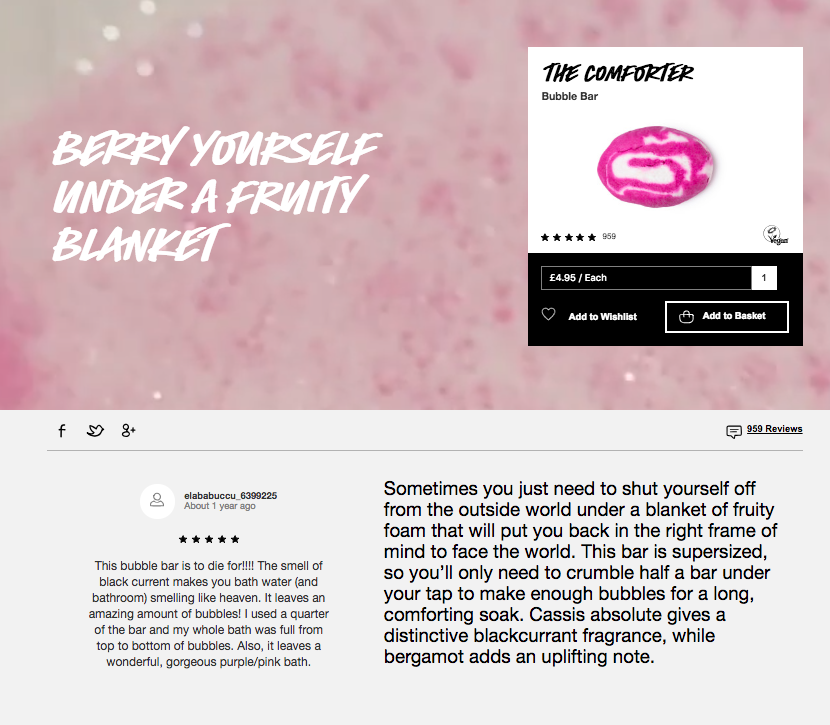
Let’s define our terms: a product description is the marketing copy that explains what a product is and why it is worth buying. The purpose of a product description is to give customers the details around the benefits and features of the product so that they're compelled to buy it. You can see on the below image, Lush have included all the information on the product, underneath the CTA where the customer can add to basket.
Whether a product has specific functions or a personal purpose for the customer, as they browse they imagine what it would be liked to own this product. Therefore, you need the descriptions to sell the product, incorporating both prose writing and journalism - your average "good" product description will just not do. Competition is growing, it needs to be great writing.
Category content is the products category page copy – this wording could be the ranking content to introduce your brand to new people and display the products you are offering to customers. It can also be used to improve sites internal linking, which is very important for an SEO strategy. You can see the category content here, for Lush 'Bubble Bars' - though this sentence is a short example of category content, it does give a good example of Lush's copy style, which is another important aspect that we will dive into soon.
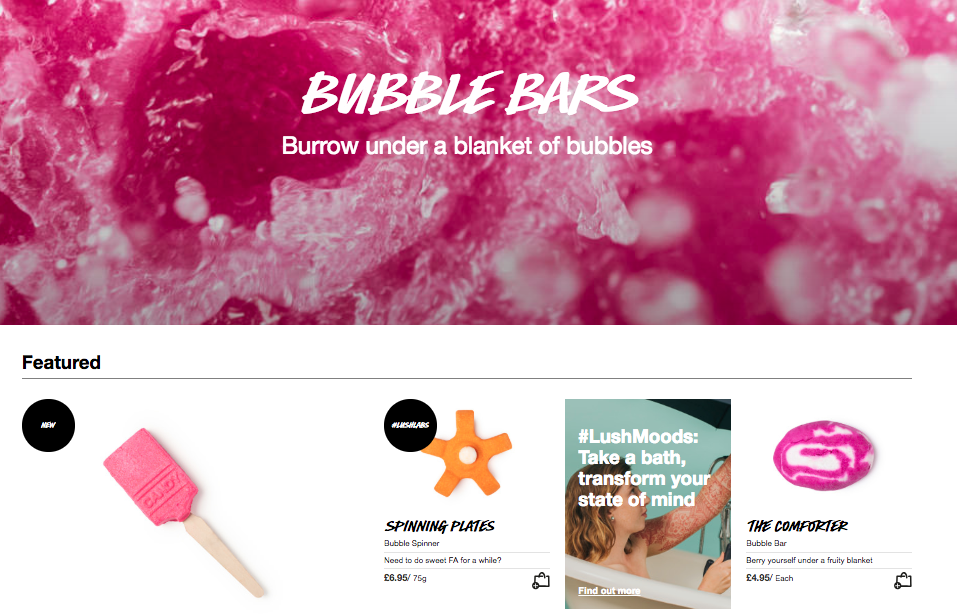
As well, without useful and unique category pages you simply have a list of products with a small amount of content that is duplicated on the product page. A category page with unique and helpful content will out-rank similar products. It should help answer any questions and offer you the chance to create a brand voice and introduce your brand.
Now while your content and products will change, your landing pages will not, so it’s worth taking the time to fully optimise them, and here is how you do so.
Step 1: Keyword research
Researching keywords is an essential part of ensuring that your category content is written with SEO in mind in order to improve site organic performance. It's helpful to think about the volume of traffic each keyword will bring, the difficulty in ranking high for it and where you are currently ranking, if at all.
Step 2: Organising your keywords by page
After you have completed your keyword research, you should make a checklist of chosen keywords and organise them into categories and subcategories - more generic words should be put as top level categories. These groups of keywords should then be assigned to your categories. If there are too many keyword groups assigned to one category then you might consider splitting that category page into two separate categories, so they can be targeted more effectively.
Category pages should be used to target the shorter more general keywords. Your product pages need to be used for targeting specific, longer keywords - the style, model and brand of product. These long-tail keywords are going to be more relevant for those who are at the end of the funnel and ready to purchase. Keep the more generic words for those category pages. Make sure to read this blog post to understand where long and short keywords come into play for your business.
Step 3: Determine the right format to describe your products
Now it's time to put together your descriptions and determine the best format. As some shoppers only scan websites, it’s a good idea to have a list of bullet points that cover the most important product details - this makes them quick and easy to read.
But, bullet points are not the best way to sell a product alone or convince shoppers that they're looking at a great deal. You need to engage a shopper’s emotions and imagination by drawing them in with a paragraph that sets a scene and realise why their life has been so incomplete without the product (like we saw with the Lush example earlier). Make it appealing.
This is your opportunity to be creative and establish a voice for your brand. Whether that be serious or casual, it’s what makes your company its own. Think of brands like Lush, or Innocent smoothies - they have established strong brand voices that are recognisable.
The voice you’re projecting speaks for every aspect of your online marketing, SEO, social media and paid search. It’s unique and compelling copy that will make your products the most relevant for search engines.
Once your product descriptions are up and running you need goals to measure their success.
Step 4: Chose goals and KPIs to measure the success of your product descriptions
This isn’t a quick process especially if you rely on product descriptions from your distributions or manufacturers. If time resource is an issue for you, then it would be better to concentrate on the categories and products with the largest potential audience growth – or your most profitable product lines, to optimise them to their fullest potential. But if you can commit to writing a handful or so product descriptions a day, you’ll see many benefits such as:
- A low return rate
- An increased conversion rate
- Improved organic search rankings
We find that measurement is a common issue for brands, as seen in our State of Content Marketing Survey results, so be sure to record what you can, and use an effective measurement tool to help you see the progression, or regression in results. We’ve got a template you can access here, to help with this issue.
Step 5: Don’t be afraid to boast
Take your product description that one step further, is your product better because it’s been through years of testing? Is it handmade? How is your product differentiated from others?
You tell a good story in your short product description by including snippets of detail that proves your product is better than the rest. So don’t be afraid to boast.
Step 6: Know when to show instead of just tell
One thing to remember is that text isn’t always the best way to describe your product. If you feel your page is looking too wordy, there’s another way you can simplify it - with an image. Show your product off visually and explain exactly what it does.
These days, people do not buy without seeing an image – especially on eCommerce sites. So, ensure that you are using good quality images, with different views. We’ve all seen those 360’ rotating images – the conversion rate on these is about 27% higher than for standard two-dimensional images. Make the views as detailed as you can.
Other than graphics, a video can be a helpful and effective way to showcase how to use a product and the features it includes. Many retail sites see this as crucial now, with a short ‘catwalk’ showing off the item. Our Lush example earlier has a video of the product being used, alongside the CTA to buy.
From the moment you create a website and begin to construct your design, think about how images and descriptions can work together to tell a story to your customers. Accompanying your content with an image or video is fundamental for eCommerce sites, it acts as the digital window for your online business. Therefore, you must ensure that the text is one hundred per cent accurate and conveys a true representation of what you’re selling.
We recommend a product description should be between 250-500 words including your keywords and product titles. But remember not to force it with spam content, if it’s not needed, don’t write it for the sake of it.
So, what does this look like when we put it all together?
Let’s say our category is facial cleansers; here’s what the category should look like.
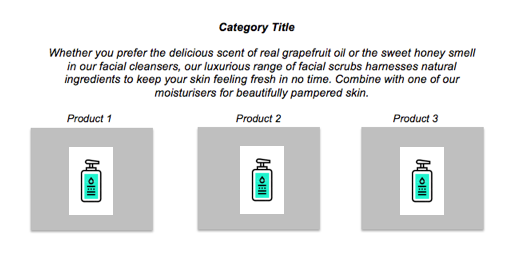
Why we love this description:
- Gives an overall description of all the products available
- Uses descriptive and accessible language
- It improves overall user experience because it gives the buyer a chance to click on the products you have available, preventing any confusion as to what you’re selling
And what about those all-important product descriptions? Again, we’ll use a face wash:
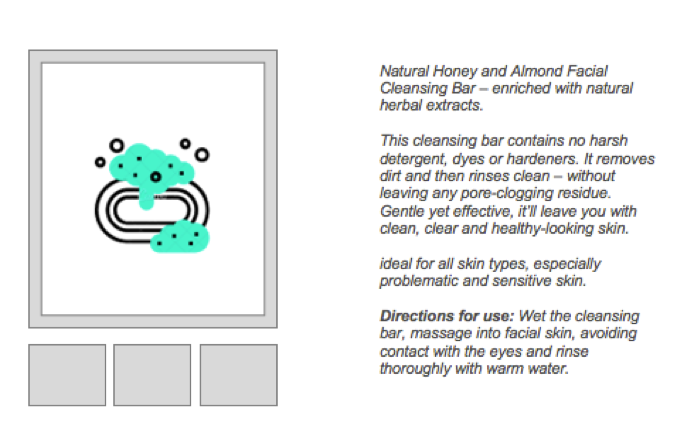
Why we love this description:
- It describes the product well: what it’s used for, how to use it and the benefits it will provide
- Contains keywords such as ‘cleansing bar’ so that the product will show up in searches from customers
- It is grammatically correct – no one wants to purchase a product from a site when the descriptions are covered in sloppy grammar and spelling errors
- Engaging to read, and doesn’t go on too long
- Uses positive language to describe the product
Measuring impact of your content changes
It’s great developing your own content and getting your brand tone of voice out there. However, if you’re not measuring the success of your marketing campaigns you'll struggle to keep track of the impact, both positive and negative. It’s crucial to get this right as it can feed into future plans, doing more of the what works rather than the white noise.
The biggest moans and groans we hear around reporting is the time allocated to it. You also struggle around what numbers are useful and what numbers are just making it look more complicated than it is.
We have a free measurement template for you to use, if you want to dive straight into your data - just click below to download that, and get started. Keep reading below where we detail how to make the most of the numbers available to you to prove the worth of your content.
Define your goals
You need to get to the heart of what you’re looking to report on - the best way to do this is by thinking about who you’re reporting to, or for. What really makes them tick? Are they a numbers or visuals person? Or do they need an easily legible report? You also need to ask what kind of KPIs are in place - we have a list of 40 to get you started - and are they focused on organic traffic, conversion, ROI, or all the above? In the eCommerce world, you most likely will be examining your click through rate, from category pages to product pages, and your conversions from product page to sale. Define these before you start changing your content, and annotate on Google Analytics the date when you make the edits. This way you'll be able to see any direct upward trends easily.
When you answer these questions, you’ll have a good idea of what you need to report on and how the reporting needs to be delivered.
Segmenting your audience for effective measurement
Any business with a website should really have Google Analytics (GA) set up and working effectively - it’s digital marketing 101. To really get GA working for you, you should have all goals set up, including revenue and ecommerce data. One of the gems of GA is setting up your own customer segments – you can really specify what data you want to be looking at.
Segments work really well in terms of efficiency as they work the same way as setting a ton of filters but this way you only have to set the filters up once and you can have a custom segment going forward. So, from GA you can find a mountain of information, traffic figures broken down by channel, revenue data, or engagement data audience data (to name a few), but there’s also a wealth of third party tools out there to tell you how well (or not) you’re doing.
If keywords and visibility is more your thing then tools such as SEMrush, ahrefs and Search Metrics may be more appropriate - ahrefs boasts the biggest and most regularly updated keywords database which makes it a great tool for finding those golden nuggets which are really driving traffic to you, before and after you make your category content edits.
Deciphering the data
Transforming all these numbers into something legible and tangible is the most important part – it’s the analysis that really brings data to life.
Excel has a great number of tools built in to make data analysis as easy as possible. Pivot tables can be used on all complete data sets to organise data into a legible table without all the time-consuming task of manually sifting through rows of information. Pivot tables effectively automate a whole load of ‘=SUMIF(‘ formulas and then aggregating the data into categories, see example below:

In this example, the Pivot table has aggregated all our data into four categories on the left-hand side and then summed together all the relevant information in the other five columns. For example, we can quickly extrapolate that the biggest opportunity is in the ‘medium/long term’ category as there’s 22,078 incremental clicks there due to the client ranking on average P51 only capturing 23 clicks a month and there’s also 720 keywords to target.
Excel is an incredibly powerful tool when analysing data, especially big data. It’s a scary world in Excel and Gsheets, full of formulas, arrays and queries but don’t worry if you’re not the biggest Excel wiz, because we have an array of handy tips for productivity!
Measuring by the user journey
Let's break down the journey into five stages and suggest the most important KPIs for each of these stages, so you can tell if the changes you've made to your eCommerce content on your site, has created a positive of negative shift.
- Awareness - how many people are seeing your brand or product line
- Consideration - how many of these people are engaging with your brand and in what way
- Conversion - how many of these interactions are leading to a sale
- Retention - who is coming back for more
- Advocacy - how many of your customers are acting as advocates for your brand and therefore introducing new customers to you
Awareness
This is an eCommerce Marketing Manager’s domain. We initially need to establish how many people are being exposed to your brand in the first place. This will give us an understanding of where your audience is coming from, how best to target them and ultimately judge the success of your marketing efforts.
1) Organic Search Rankings
This SEO metric looks at all traffic that’s earned, not paid. If your targeted audience is using a search engine to find a brand that offers a particular product then it’s hugely important that you feature as high as possible on the search engine results page (SERPs). After paid ads, Position No.1 (P1) is optimal and, as illustrated in the below graph, will give you the best chance of a high click-through rate (CTR).
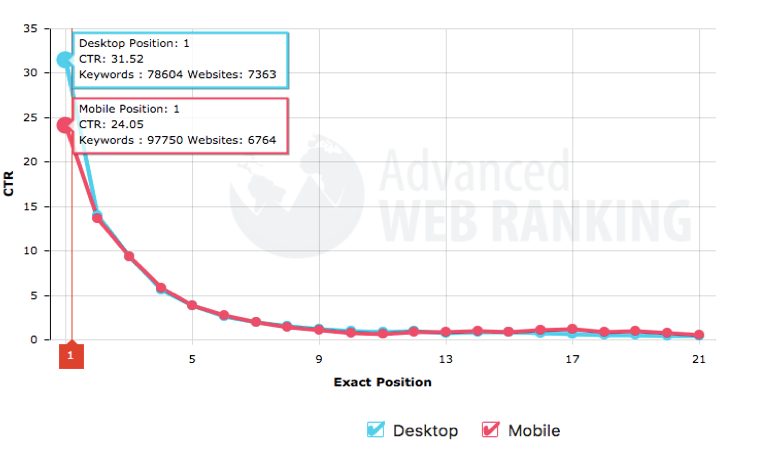
Not only does this chart show a clear correlation between a high SERPs position and high CTR but also that the drop between P1 and P5 is severe. With this in mind, your first KPI should be around rankings, namely that head terms from your keyword set are in positions 1-3 within SERPs.
2) Average Ranking vs Weighted Average Ranking
Once you have your individual keyword rankings, you’ll be able to work out the Average Ranking of your head terms. This is a more advanced way of looking at search volumes so can be useful to track. However, not all of your key terms will generate as many searches, and terms that get 200 monthly searches should be treated differently to those that get 20,000 monthly searches, depending on the intent of the consumer at that stage (ie. does this keyword indicate they just doing research on products, or are they ready to buy?).
So, in order to give more value to the keywords that deserve it (your most profitable keywords) we need to work out the Average Ranking Weight. The below table shows an example keyword set for a fashion house:
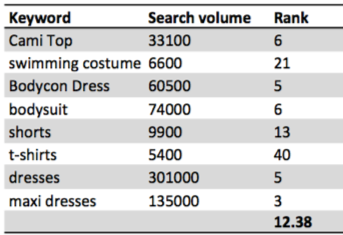
From the above keyword set we can see that ‘dresses’ has the biggest opportunity to drive more traffic to the site with an impressive search volume of 301,000. We can also see that this particular keyword is ranking quite well at P5. In contrast, we can see that ‘t-shirts’ has a relatively low search volume of 5,400 compared to the rest and isn’t doing very well in the rankings at P40.
With this in mind, if we were to work out the Average Ranking for the keyword set, it wouldn’t take into account the value of each keyword and less important terms may bring down the mean and thus give an inaccurate result. This, then, is where the Weighted Average Ranking comes into play, giving each keyword the weight it deserves. Below are three basic steps to work out your Weighted Average Ranking:
Work out the weighted value of each keyword:

We now need to work out the weighted rank of each keyword. Here’s how:
![]()
Once we have the weighted rank of each keyword, we need to add them all together to find the Average Weighted Ranking:
The below table gives you all of the above for our example keyword set. The chart is an illustration of the potential difference between an Average Ranking and the Average Weighted Ranking:
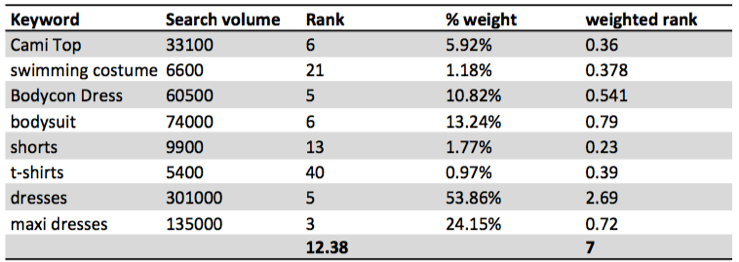
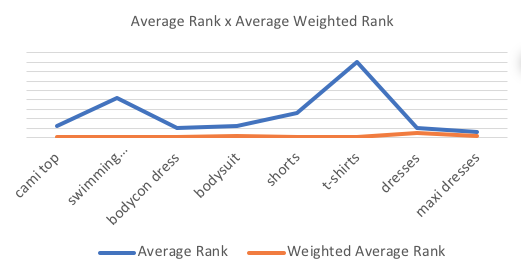
The above table demonstrates the potential difference between an Average Rank and Average Weighted Rank.
3) Site Visibility
Another metric linked to search rankings is search visibility – this is a score that gives you an estimated percentage of clicks that you can expect to receive based on your organic ranking position, across your entire campaign keyword set. There are many tools that will give you this information including Search Metrics. Another benefit of this metric is that you can compare your own visibility to a number of your competitors to gauge their performance against your own.
4) Branded Traffic
Within Google Search Console you’ll be able to find out how many people are searching for your brand name directly. This will give you an indication of the visitors who already have your brand in their consideration set, and have come to you directly. The level of this could inform you how much effort should be put into your brand awareness marketing, so that you can attract more people looking specifically for your brand, or indeed, how well your marketing efforts are doing overall.
5) Facebook Ads Reach
As of December 2017, there were 2.13 billion Monthly Active Users on Facebook and growing. It’s been calculated that the average time a user spends on the site is 35 minutes per day. No surprise then that the social networking site is often seen as a crucial part of a brand's marketing efforts. This said, it’s a saturated platform and the regular algorithm updates mean that marketers need to be sure they’re getting a good return on investment; Facebook Ads Manager Reports are a great way of tracking the peaks and troughs of your reach and engagement metrics, to see if algorithm changes have directly affected your results. There are a number of important engagement metrics to focus on within these reports to ensure your ads are targeting the right demographic and help you to understand what works for your brand and what doesn’t, thus allowing you to optimise accordingly. The main KPIs to look at here are:
- Impressions – the number of times your advert is on someone’s screen
- Reach – the number of people who saw your adverts at least once
- Clicks – the number of clicks on your adverts
- Cost per Link Click – the average cost per each link click
Consideration
For many marketing managers, this will be the most important stage to track, to understand how many people are visiting your store and what percentage of these are actually engaging with your brand. It can teach us a lot about the design, content and structure of a site. Within the consideration stage, there are countless areas of analysis to help establish the quantity and quality of people who are interacting with your brand. To simplify, we’ll break these down into two main areas; organic traffic and behaviour.
6) Organic Traffic
The most important KPIs here are simple – how many people are visiting your site, at any given time. Within Google Analytics a quick search can give you this data which can then be further analysed by comparing to previous date ranges i.e. WoW, MoM and YoY.
- Sessions – a single session is the period of time a visitor is actively engaged with the site
- New Users and Returning Users – the number of first-time and returning visitors to your site. This data will give you a sign on how well the awareness and conversion stages of your campaign are performing, respectively
In theory, the more people you have coming to your site, the better. However, if these visitors are coming to your site but leaving straight away, they aren’t of much value. We therefore need to delve further into the behaviour of these visitors in order to measure the success of your site; namely its design, structure and content.
7) User Behaviour KPI's
These measures will give us an understanding of your visitor’s level of engagement and essentially the quality of the traffic visiting your site. This, in turn, will give us an idea of the quality of your site.
- Bounce Rate – the percentage of single page visits. In other words, the percentage of people who visit your site and leave without any engagement.
- Average Session Duration – the average amount of time a visitor is on your online store. This metric, alongside bounce rate, will help you to determine how engaging your site is.
- Pages per Session – the average number of pages viewed during each session.
- On-Page Actions – Google Tag Manager will be able to give you information on how your users are interacting with your site by tracking the number of people who click on specific areas, for example, a call to action. This information may help you to optimise your Information Architecture.
Once you have this information you may decide to make changes on the site to optimise. For example, if your site’s bounce rate is high you may want to consider making changes to the design of the landing pages to ensure they’re engaging and user-friendly. You can find out more around this including tips and best practice in another of our blogs, on Conversion Centred Design.
Conversion
For most eCommerce managers, this is the crux of the journey. How many of the people you’ve got to the site are actually converting by making a transaction and subsequently generating revenue for the company? Key KPIs to track at this stage are:
8) Transactions
The total number of individual sales on site. It’s important to understand this as well as the revenue in order to calculate Average Order Value (AOV).
9) eCommerce Conversion Rate
This gives you the percentage of sessions that resulted in a transaction. You’ll get this figure by dividing the number of transactions by total sessions. This figure will feed back into the sales funnel as it’s crucial to help calculate how much traffic you need in order to hit certain sales targets.
10) Revenue
The total monetary value of all on-site transactions.
11) Average Order Value (AOV)
By dividing the total sales by the total number of transactions, you’ll get the average value of each individual transaction. You may have to do further analysis here depending on how varied your product range is. Knowing your monthly AOV will allow you to monitor and even influence trends and optimise accordingly.
12) Basket Abandonment Rate
This is the percentage of users who put products in their basket but don’t complete the transaction. Knowing this will help influence your follow up communications. For example, if you have a high Basket Abandonment Rate, you may decide to start sending out reminder emails i.e. ‘Don’t forget these items in your basket!’
Retention
Once a customer has completed a transaction it’s important that we continue to track shopping behaviour and get a measure of the general customer loyalty. This information will help to influence your post purchase marketing strategies and how you get customers back to the site.
A few of the main KPIs to look at here are:
13) Returning Users
This metric will tell you how many of your visitors are new to the site (that haven’t visited from that particular device/browser in the last two years) and how many are returning. A quick search within Google Analytics or a similar tool will give you this data.
14) Purchase Frequency
This is the number of times the average customer makes a transaction from your site in a given period:

15) Repeat Purchase Rate (RPR)
In layman’s terms, this is the percentage of customers who have made more than one order. Tracking RPR on a regular basis (daily, weekly or monthly) will allow you to measure the success of any efforts you’re putting in to improve the loyalty of your customers i.e. email marketing, loyalty schemes etc. In order to work out your RPR you’ll need to use the following formula using data from your CRM:

Advocacy
It’s important not to forget how powerful your current customers can be in growing your audience. A 2017 article from Trust Pilot suggests that ‘people are four times more likely to buy when referred by a friend’. Providing they’ve had a good experience, your customers can be a very powerful and, compared to traditional marketing techniques, a relatively cheap tool in spreading awareness of your brand compared to Social Media, email and day-to-day conversations. Keep an eye on what your customers do after they buy:
Reviews – Both brand and product reviews are incredibly important for an eCommerce store by helping to get new people into the top of the sales funnel. A recent study by Podium, summarised by The Drum, shows how significant a 5 star review can be to your business. It reveals 93% of consumers say they are influenced by online reviews so much so that 68% of consumers would actually be willing to pay up to 15% more if they are assured they will get a better experience.
Social Shares – Social shares of your brand or product can act like free advertising for your eCommerce business. Not only does it allow you to measure how well your social marketing campaigns are performing, it can also give you an idea of how many more views you’re getting outside of your own following. It has been predicted that the average number of Facebook followers per account is 338. So, let’s say your post gets 50 shares, there is potential for your ad to reach an additional 16,900 people. Again, getting new prospective consumers into the top of your sales funnel.
There are countless ways to measure an eCommerce site’s performance, this only touches on a small percentage of these, however, even with a few we are still able to see how important KPI setting can be for your campaigns success.
Tying it all together
In conclusion, writing killer category content and product descriptions requires time, effort and some forward thinking, from both a content and SEO perspective. With customer retention, brand reputations and SEO strategies, it’s worth putting in the work to produce high quality and captivating content that will ultimately improve your conversions, sales and grow your business.
Sign up for our monthly newsletter and follow us on social media for the latest news.


 Proudly part of IPG Mediabrands